Area Statistics
Area Statistics may be used when you are selectively interested in the Profiler Statistics. This functionality allows you to define an area (e.g. function, variable state, OS task, Profiler Inspector state) which will be used as a time-based filter for the Profiler Statistics.
Configuring Area Statistics
|
Open Area Statistics window. |

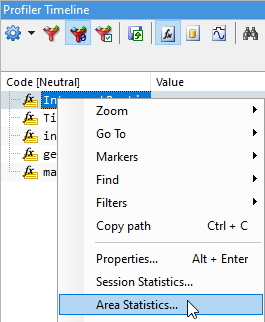
Right-click an area (from now on called parent area) in the Profiler windows and select Area Statistics.
This will open a new Area Statistics window which will show the Profiler Statistics for all configured areas, but only for the time when the parent area is active (indicated by the red color in the Profiler Timeline of the parent area). The time when the parent area is inactive is not considered for this statistics.
|
Further configuration through the navigation toolbar. |

The Area statistics can be calculated either.
|
Export. |

Refer to the Profiler Export chapter.
|
The Area Statistics can be exported as usual, but note that if you choose to export the Profiler Timeline as well, the timeline will be exported in full (not filtered). |
