XCP Slave plugin
In this topic:
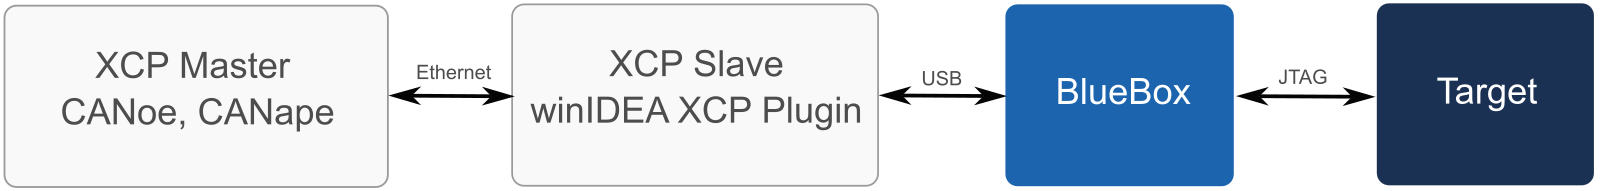
The XCP Plugin window is a lightweight implementation of an XCP Slave. It enables measuring and calibrating of the target ECU without impacting overall ECU’s performance or memory footprint.
It is an interface between a measurement / calibration tool like CANoe or CANape and the rest of the tools stack down to the target ECU.
All supported microcontrollers can be handled by the XCP plugin. It enables the measurement and calibration of an ECU without the need of any slave code on the ECU, without performance degradation to the ECU operation and without the need for a physical interface (like CAN, FlexRAY, …), other than the ECUs CPU debug or trace ports.
The XCP plugin supports polled mode access, where access is directed from the XCP master and also high speed data acquisition, where data accesses are directed by the debugger (iC5000, iC5700, …) and streamed to the XCP master.
Features
•Synchronous data acquisition (DAQ)
•Direct memory access (Polling)
•Online memory calibration (read / write access)
•Time stamped data transfer, generation of event timestamps by the ECU/Emulator
•Trace-to-XCP bridge
•A2L file generation
Limitations
•Ethernet transport layer supported only
•Only dynamic DAQ list supported
•Bypassing is not supported
•Block mode is not supported
•Resume mode is not supported
•Checksum is not supported
•Dynamic event list (Plug-and play) is not supported
Performance Characteristics
Characteristics |
Value |
Timestamp resolution |
1 µs |
Min sampling interval – polling |
1 ms |
Min sampling interval – DAQ |
100 µs |
Bypassing latency time |
< 500 µs |
Max DAQ events |
256 |
Max DAQ per Event |
1 |
Max ODT entries |
256 |
Max ODT entry size |
8 bytes |
XCP Plugin window
You can open the window via View / XCP / Status window.
Icon |
Description |
|---|---|
|
Start |
|
Stop |
 |
Generate A2L File |
 |
XCP Plugin configuration |


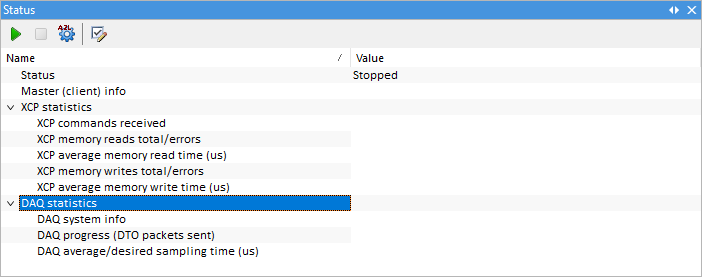
Rows information
Status - Displays the general XCP plugin status (Stopped, Running / Listening).
Master (client) info - Displays the master connection status (whether a master is connected or not).
XCP statistics - Displays overall XCP commands statistics. Memory reads, writes and errors are reported separately.
DAQ statistics - Displays the overall DAQ acquisition performance.
Configuration options
Configuration options are displayed in a separate window.
Option |
Description |
|---|---|
Port |
(Listening) communication port of the XCP plugin. |
Auto-Start |
Sets whether the XCP plugin is started automatically. |
TimestampUnit |
Timestamp unit in DTO XCP packets |
TraceToXCP |
Configuration of Trace-to-XCP feature |
Enable |
Use trace as a data source instead of data acquisition performed by the emulator |
SendAlways |
Send data even if there was no change since the last transmission. Deselecting this can greatly reduce the XCP master load at high sampling frequencies. |
TrdPath |
Path to winIDEA Analyzer recording, which contains trace configuration of the sampled data. |
A2LPath |
Path to the generated A2L file, which contains the generated DAQ events. |
Modes of operation
The XCP Plugin enables ECU measurement (ECU’s memory observation) and ECU calibration (ECU’s memory write). In all cases, it is the master’s (CANoe, CANape) responsibility to set-up the measurement environment.The ASAM 2MC configuration file (extension .A2L) is a good starting point to prepare the measurement environment. A default WINIDEA_XCPSERVER.A2L file is provided for easy start-up. On the master side, data acquisition may be configured as DAQ or Polling. DAQ is recommended as data acquisition is much faster and the sampling interval more consistent.
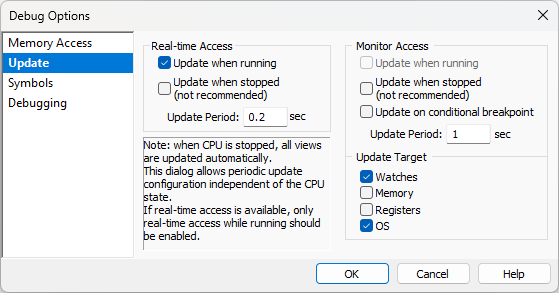
DAQ mode
In DAQ mode, data acquisition is performed by the debugger. For maximum performance, disable real-time access (via Debug / Debug Options). If real-time memory access is enabled and in use, the debugger and the DAQ aquisition subsystem will compete for resources, resulting in a slower or less stable sampling interval.
 |
 |
Example
DAQ configuration in CANoe:
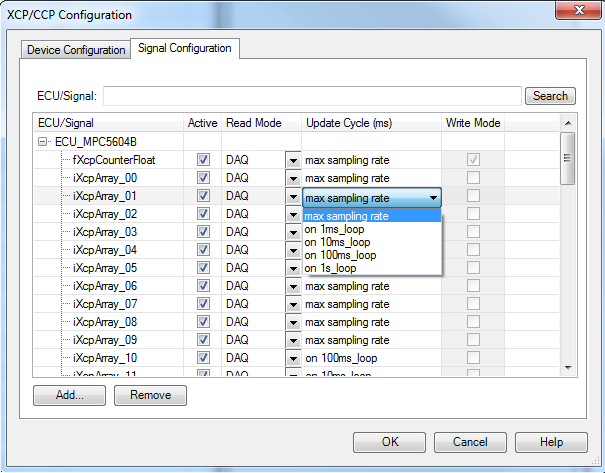 |
In this case, iXcpArray_01 variable will be sampled by the emulator at a maximum sampling rate. Whenever a variable changes, an event is triggered and data streamed to the XCP master. When DAQ is running, this is clearly indicated on the XCP's plugin main page.
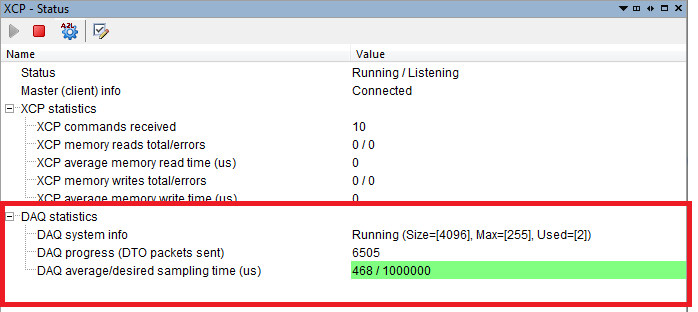 |
DAQ Performance issues
General performance is indicated in the line »DAQ average/desired sampling time (us)«. Desired sampling time comes from minimum required event sampling time (see table):
DAQ event name |
DAQ event number |
Desired sampling rate (ns) |
|---|---|---|
max_rate |
0 |
max possible rate |
1ms |
1 |
1.000 |
10ms |
2 |
10.000 |
100ms |
3 |
100.000 |
1s |
4 |
1.000.000 |
If average sampling time exceeds the desired minimum required sampling time, the status line appears in red, clearly warning the end user of irregular sampling conditions.Please take care when deciding on event number. Events 0 and 1 cause a lot of traffic on the debug port, which could lead to irregular measurement conditions.
Polling mode
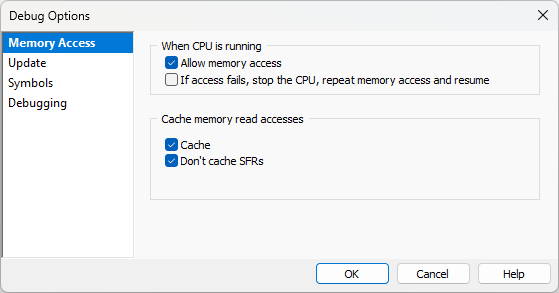
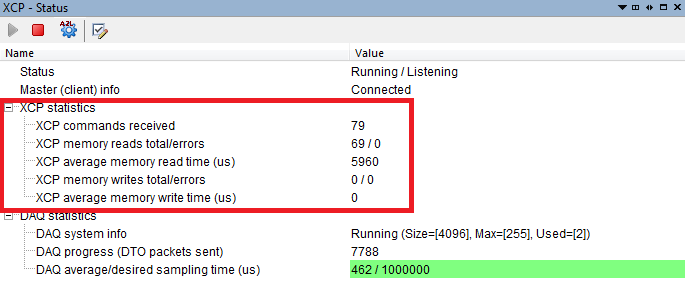
When the polling mode is used the memory access requests are generated by the master. The XCP commands (read and/or write to ECU’s memory) are processed sequentially by the XCP slave. The statistics are clearly displayed in the “XCP statistics” section.
|
Memory access under Debug / Options / Memory Access must be ENABLED in this case. |

|
Example
Polling configuration in CANoe:
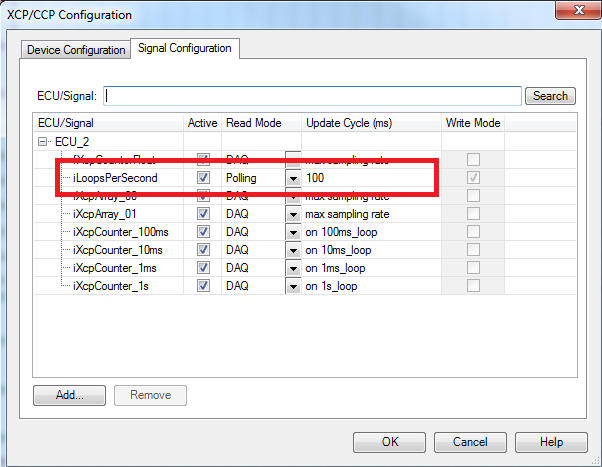 |
In this case, every 100 ms a read request is forwarded to the XCP plugin, which reads the ECU’s memory. Statistics about the operation of the plug-in in this mode are shown on the XCP plugin statistics section:
 |
If real-time memory access is not enabled, access to ECU’s memory is disabled. Statistics under XCP memory reads total/errors show the number of unsuccessful attempts. ERR_ACCESS_DENIED is returned to the master.
Trace-to-XCP
Trace-to-XCP feature allows an XCP Master to acquire the data from the target ECU which has been collected by winIDEA by a means of trace. This allows a tightly controlled data sampling with exact period.