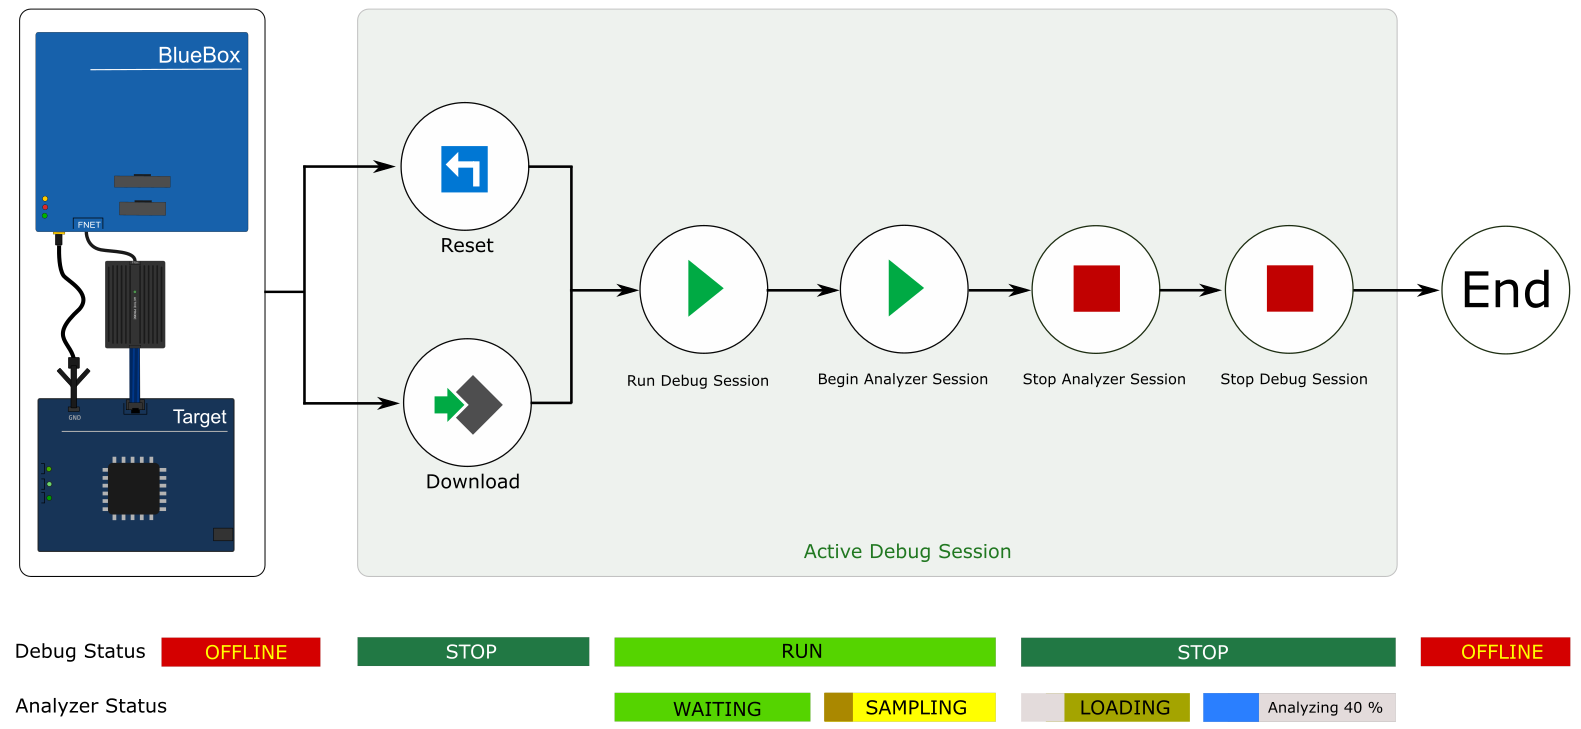
Running the Analyzer
Once the Analyzer is configured, you can start the trace recording. This chapter covers details on starting an analyzer session, inspecting the recoded data and saving the files for later use.
|
Note that the Analyzer Status does not depend on the Debug Status, e.g., LOADING or ANALYZING could happen also during Debug Status RUN - if buffer on the debugger is full. |
|
Start a Debug Session. |
|
Run the Analyzer via Begin New Session. |
Analyzer status bar will show  until a trigger is signaled.
|
Stop the Analyzer session. |
The Analyzer session can be terminated several ways:
•Automatically, if:
oBlueBox trace buffer / OCTB is filled (except when the continuous mode of operation is used).
oAnalyzer file reaches the continuous mode.
•Press Stop  via:
via:
oAnalyzer toolbar to stop the Analyzer session. Note that loading and analysis will still be performed.
oDebug toolbar to stop the CPU, which also stops the Analyzer session.
Once the Analyzer stops recording, it will continue LOADING the trace data. Status bar will display  . Note the dark yellow bar indicates the amount of trace data left to transfer to the PC.
The file size status bar  indicates how full the Analyzer file is - in case the file is full, the loading will stop and the recording will be incomplete. Refer to the Recorder Configuration to learn how the file size limitation can be changed.
Loading of the trace data can be manually stopped by clicking the Stop button (analysis will still be performed).
|
Analyze trace data. |
Once the trace data is uploaded to the PC, it is immediately analyzed:
•Program flow reconstruction
•Coverage Analysis
•Profiler analysis.
During this time the status bar will show Analyzing  .
.
|
Re-analyze (optional). |
In case you would like to change some analyzer settings/use different version of winIDEA, you can re-analyze the existing trace data press Re-analyze last session  button.
|
Inspect the recorded information. |
Once the Analyzer finishes the analysis, you can view (based on the Analyzer Configuration):
•Profiler Analysis results
•Coverage measurements
|
Configure the Analyzer Recording for saving (optional). |
You can configure how to save the Analyzer Recording by clicking the Options  button. Refer to Analyzer Options / General page.
|
Save the Analyzer Recording. |
Once the Analyzer recording is complete, you can save it via File / Save while the Analyzer window is selected. File will be saved as a .trd, proprietary file format. You can also choose to export the Trace, Coverage or Profiler data to a number of supported formats, but they can not be imported to winIDEA again and used as an Analyzer file.
|
Set information (optional). |
Add various information to you Analyzer Recording. Refer to the Analyzer Recording information chapter.


 will indicate how much the BlueBox trace buffer has been already filled.


