Filtering and Searching
This chapter explains how to navigate in the Profiler Timeline window; how to use filter and how search for specific data.
Filtering
The list of displayed areas is determined with the Profiler settings, but list can be further narrowed with the filters.
Apply a filter
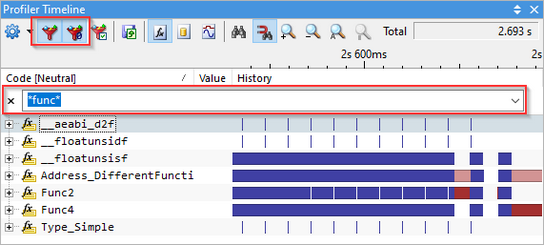 |
Filter items button - Filtered the function names based on a wild card expression (* and ? are supported). If you specify multiple expressions separated by space, areas that match any of these filters will be shown.
Hide items with no activity button - Hides all areas with no activity.
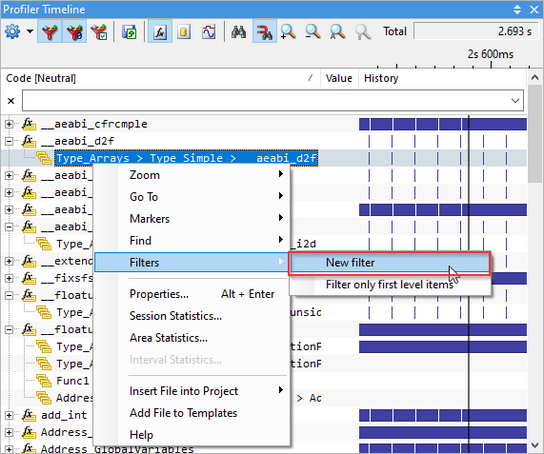
Add a new filter
|
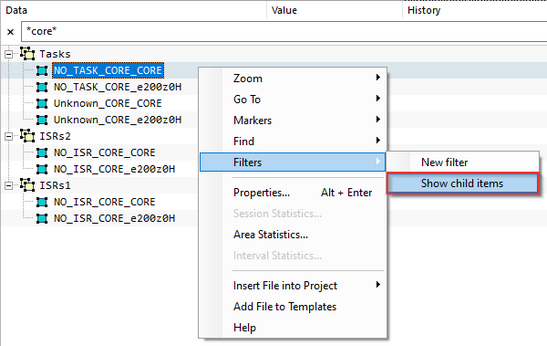
Show child items
Option Show child items will display children of tasks when filtering.
 |
Example
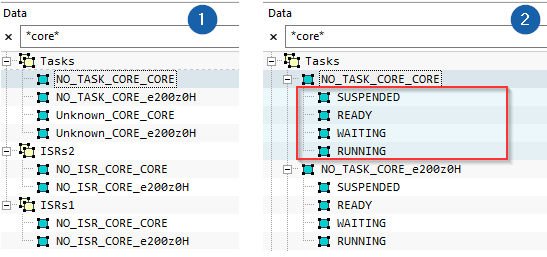 1. Regular filtering. 2. With option Show child items enabled (SUSPENDED, READY etc. are also visible since the parent item is a match). |
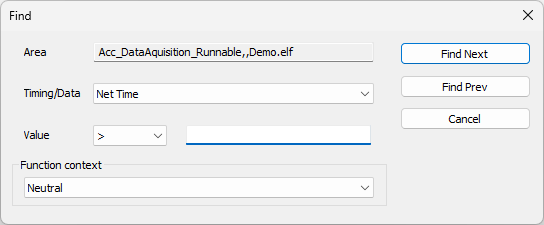
Searching
With the Find tool you can search for particular events in a scope of the selected area.
1. Select the area you are interested in and open Find dialog (CTRL+F).
2. Enter the search criteria, which can be any of the statistics available in the profiler (net, gross, call, inactive time), units s, ms, us, ns are supported.
3. When a match is found, the timeline markers will be set around the event. If Snap area on find  is enabled, the result will be snapped into view.
|
Context Selection
If an operating system is running on the embedded target, analyzer can be configured to record task switches, so that the program flow can be correctly reconstructed. In such case click the Context button  and select the context you wish to analyze. Note that Profiler creates one additional context for each core (called unknown_<coreID>), to which it attributes all events that happen before the OS task is first signaled.