

Vector MICROSAR
Vector supports, manufacturers, and suppliers the automotive industry and related industries with a professional platform of tools, software components and services for developing embedded systems. MICROSAR is Vector's embedded software for AUTOSAR ECUs. It consists of the runtime environment MICROSAR RTE and MICROSAR basic software modules (BSW) including the operating system (MICROSAR OS).
Vector and iSYSTEM collaborate in customer and research projects to support the interface between MICROSAR and winIDEA IDE.
Are you planning to use our tools together with Vector DaVinci Configurator to analyze the timing behavior of your MICROSAR application?
Are you interested in thread states or Runnable timing information?
Get in touch with us and we will help you set it all up!
Vector-iSYSTEM Timing Bundle

The new Vector-iSYSTEM Timing Bundle contains a step by step guideline to integrate scheduling tracing across the whole tool chain. From the configuration of the MICROSAR.OS within the DaVinci Configurator Pro via iSYSTEM WinIDEA to the analysis of the result in Vector's TA Tool Suite. Additionally, it delivers the necessary scripts to automatize the entire process.
Video tutorial (link on the right) shows how to get started with OS profiling using the Vector-iSYSTEM Timing Bundle.
Vector MICROSAR OS Debug and Tracing
Vector DaVinci Configurator creates an AUTOSAR ORTI file which tells the debugger how to get information about OS objects such as Tasks, ISRs, and Alarms. The information from the ORTI file can be used to display OS information while debugging, or to provide dynamic information via on-chip trace techniques. Additionally, an iSYSTEM proprietary XML file provides support for advanced trace use-cases such as thread state profiling or VFB tracing.
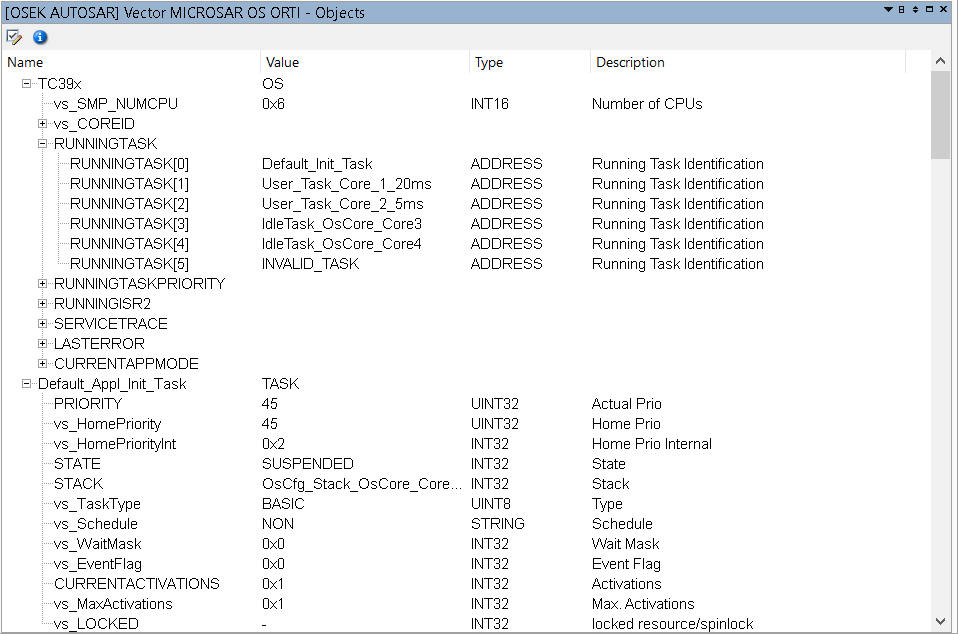
OS objects debugging based on AUTOSAR ORTI File
A snap shot of the status of all OS objects described in the ORTI file can be displayed via the OS Objects view. This view is accessible in winIDEA via the View, Operating Systems, Objects menu. For multi-core applications a multi-core ORTI file can be generated in Vector DaVinci Configurator by selection ORTI Debug Support ORTI_23.
Task/ISR Profiling based on AUTOSAR ORTI File

Standard ORTI Running Task and Running ISR2 tracing can be achieved by importing the ORTI file generated by Vector DaVinci Configurator into winIDEA.
There is no need for code instrumentation as all required run-time information can be obtained by monitoring OS internal data objects by means of on-chip hardware trace mechanisms.
Thread State Profiling utilizing the Vector Timing-Hooks
In certain use-cases, for example calculating the response time of a task, profiling the running task is not sufficient. For those use-cases a complete thread state trace of a MICROSAR application can be recorded. A thread state trace contains information about preempt, resume, wait, and terminate events in addition to the running thread information. A thread state trace can be recorded by utilizing the Vector Timing Hooks. These are dedicated hooks which can be used to signal relevant thread state information to the profiler.
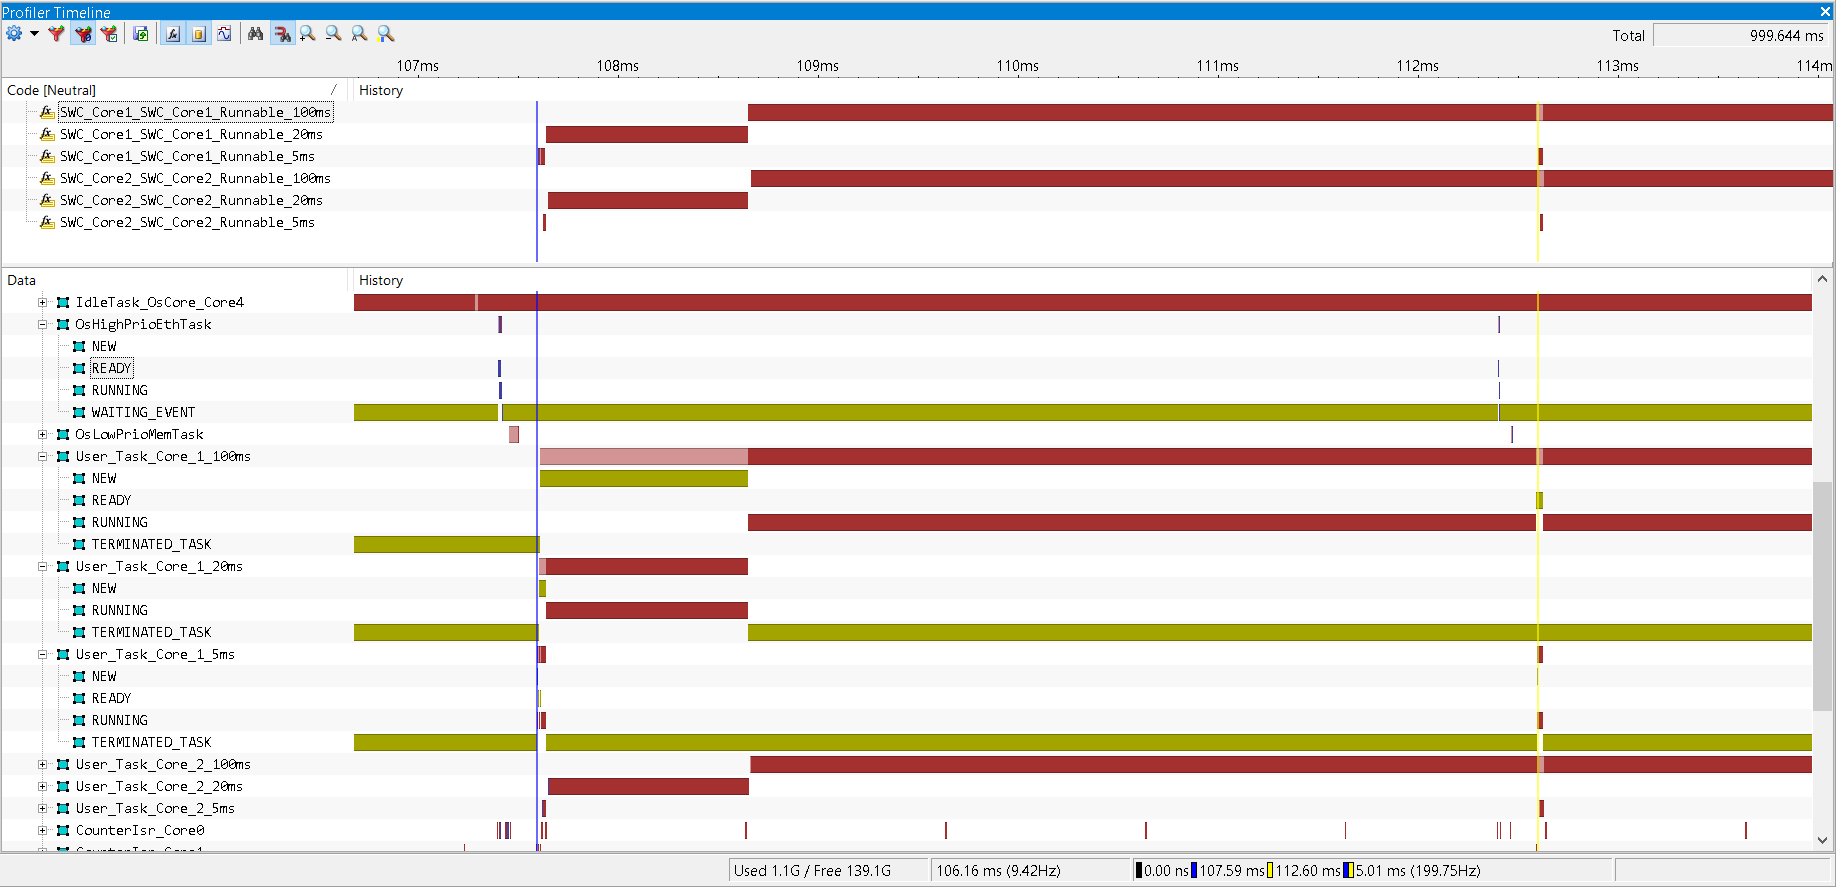
iSYSTEM provides working code for different hardware architectures and compilers that can be added to the application. A dedicated iSYSTEM Profiler XML file is used to inform the profiler about the signaling. With this approach a complete thread state trace including the waiting (a task is waiting for an event or semaphore) and new (a task has been activated but not started yet) states can be recorded as shown on the following screenshot.
In addition to the currently running thread a thread state trace (see figure on the right) also contains the information about when a thread is activated, preempted/resumed, and terminated as indicated by the NEW, READY/WAITING, and TERMINATED states.

Vector MICROSAR RTE Virtual Function Bus (VFB) Tracing
A standard feature of the RTE is Virtual Functional Bus (VFB) trace. Individual Runnables can be selected by the user for VFB trace. The RTE generator automatically generates empty Trace Hook functions, Runnable Start and Return Hook. These hook functions can be filled by suitable trace instrumentation code to support Runnable profiling by means of hardware data trace. iSYSTEM can support customers in implementing those hooks in a convenient way.
Vector MICROSAR Timing-Analysis
Based on the profiling data recorded via hardware tracing the timing behavior of a Vector MICROSAR application can be analyzed. By default, the winIDEA Profiler provides a standard set of timing metrics. For advanced use-case iSYSTEM Inspectors can be used to cover arbitrary timing-scenarios like AUTOSAR event-chains. Compatibility with the leading timing-analysis tool vendors is guaranteed by supporting the standardized BTF trace format.
Profiler Standard Metrics
The winIDEA profiler comes with a set of standard timing-metrics to analyze the runtime performance of a Vector MICROSAR application. Those metrics are calculated for all profiler objects such as threads (tasks and ISRs), Runnables, and functions. The metrics include net execution time, gross execution time, inactivate time, number of occurrences, and period.

Timing-Extensions & Event-Chain Analysis using iSYSTEM Inspectors
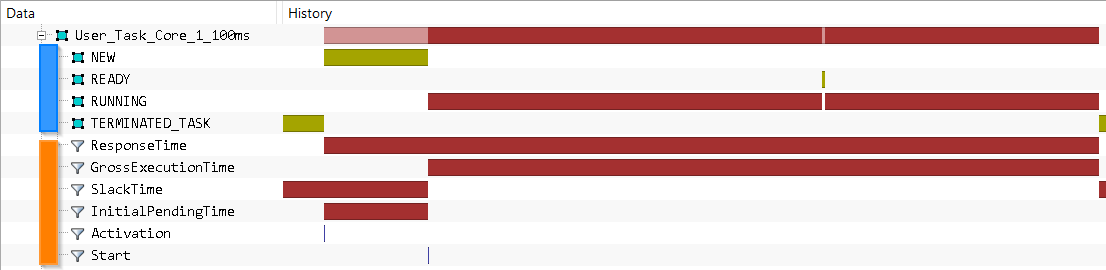
The iSYSTEM Profiler features so-called Profiler Inspectors. These inspectors allow a user-defined post-analysis of the Profiler Timeline. They can be used for sophisticated, user-specific event-chain analysis of trace recordings, presented by the Profiler. An inspector allows the creation of a new profiler object, derived from the analysis of already existing profiler objects.
As shown in the figure, such inspectors can, for instance, be used to derive standard AUTOSAR Timing Metrics (according to AUTOSAR_TR_TimingAnalysis). On the figure you can see AUTOSAR Timing Metrics (orange) calculated by means of iSYSTEM Inspectors based on the OS thread states (blue).
BTF Export for Timing-Analysis in Third-Party Tools
Profiling OS Task States and Runnable allows the iSYSTEM Profiler to export the profiler timeline into the Best Trace Format (BTF). BTF is a standardized trace format used in the automotive industry. This allows a seamless import into various Timing Analysis tools (Vector Informatik TA Inspector, INCHRON chronSIM, Luxoft SymTA/S).
More resources
| Type | Link | Description |
|---|---|---|
| Vector MICROSAR Profiling |
This application note describes how to use the iSYSTEM winIDEA Analyzer for the timing analysis of the Vector MICROSAR operating system. |
|
| Vector-iSYSTEM Timing Bundle | A step by step guideline to integrate scheduling tracing across the whole tool chain. From the configuration of the MICROSAR.OS within the DaVinci Configurator Pro via iSYSTEM winIDEA to the analysis of the result in Vector's TA Tool Suite. | |
| Automatic Timing Simulation and Execution Time Measurement with AUTOSAR | This Vector-iSYSTEM Case Study describes how to automate and combine timing modeling with on-target execution time measurement to ensure the performance of real-time multi-core systems. | |
| Non-Intrusive AUTOSAR OS and RTE Profiling of Vector MICROSAR Applications | This webinar aims at users who are developing applications for microcontrollers that provide full data and program flow trace capabilities via a dedicated trace interface. | |
| AUTOSAR OS and RTE Profiling of Vector MICROSAR Applications with Instrumentation | In this webinar we will take a detailed look into OS and RTE profiling of an MICROSAR OS based application. Specifically, we will utilize the Vector OS timing hooks to record task states and ISRs, as well as the VBF trace hooks to record Runnable events. The demo will be done on an Infineon TC399XE based application, but the knowledge is applicable to the other architectures. |