Call Stack Profiling
In this topic:
Introduction
Call Stack analysis is displayed in the Profiler Timeline and Profiler Statistics windows and it shows from where the function was called and which functions were called from this function. It is selected from Analyzer Configuration / Profiler page.
Applies to all Operation modes expect Flat, because this operation mode does not record call stack.
Configuration steps
|
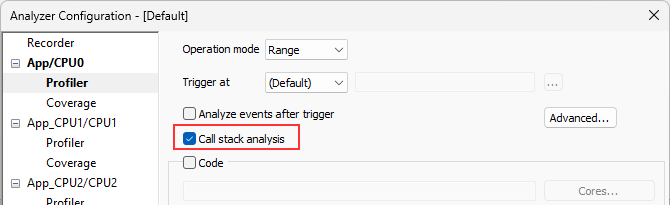
Open Analyzer Configuration / Profiler page. |

Image:
•With text
•Padding: 0
•Display size: 99.9, % of page width, maximum is physical size.
•MAKE SURE images are more or less the same sizes, use Image Editor tool, adjust other images to the biggest dialog
|
Make sure correct Operation mode is selected. |

|
Select Call stack analysis.. |

|
Click Reanalyze button in the Analyzer toolbar. |

Results
Results are displayed in the Profiler Timeline and Profiler Statistics windows.
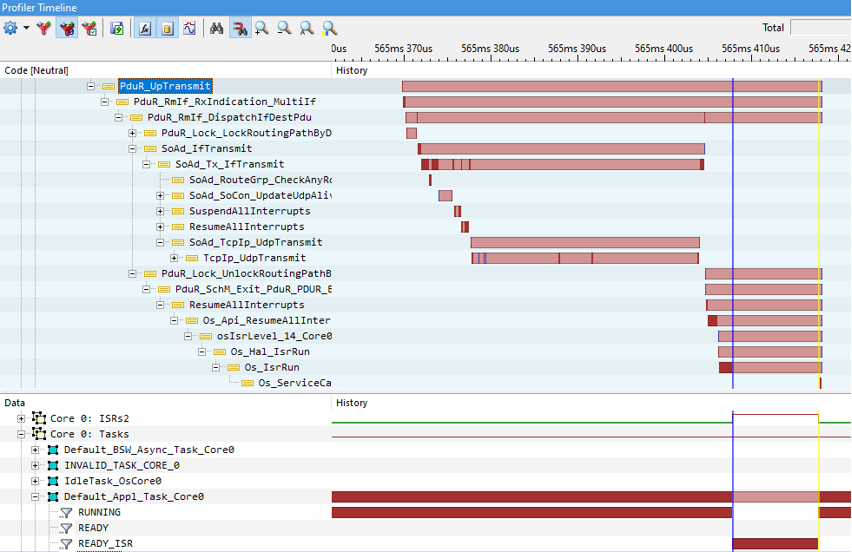
Call Stack analysis in the Profiler Timeline window displays:
•(Gross) Time of Sub-Functions
•Dependencies/Sequences within Operations
PDU - Protocol Data Unit
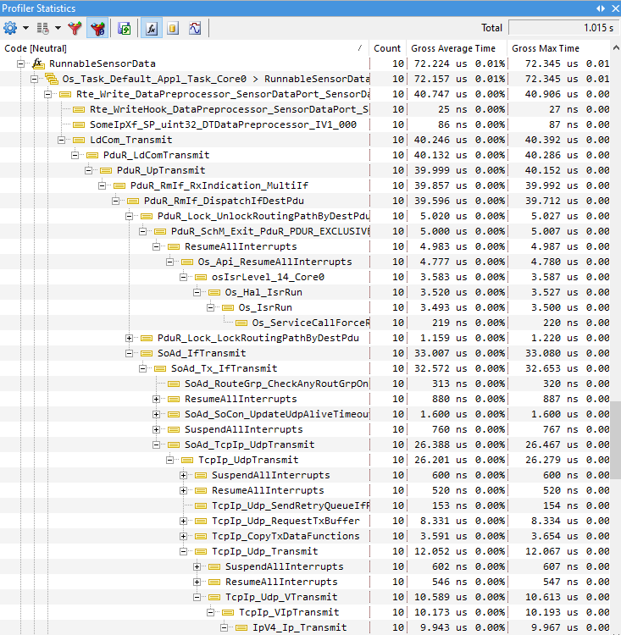
Call Stack analysis in the Profiler Statistics window displays:
•which Sub-Function contributes how much time within a certain operation, e.g. sending data (SensorData) via Ethernet using an RTE Write Port)
•the maximum Function Call Tree Depth Useful for allocating sufficient Program Stack for each OS Task.
•the sequence of Function calls within a certain Operation.
Export results
Note that only call stack areas that are children of normal function area are exported.
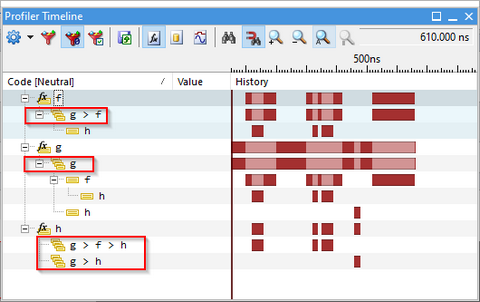
Call Site examples
1. Specified call sites in the Symbol Browser window.
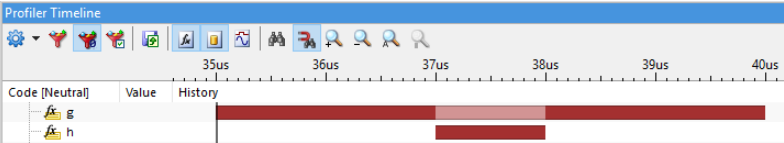
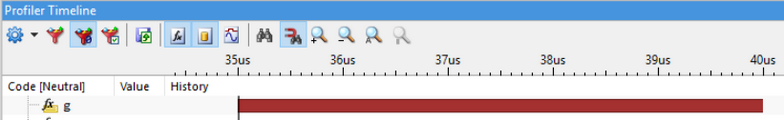
2. Function g calls function h and only function g is configured for profiling:
3. Function g calls function h and both are configured for profiling: