Statistics Properties
In this topic:
Introduction
Statistic Properties describes how each statistic is calculated.
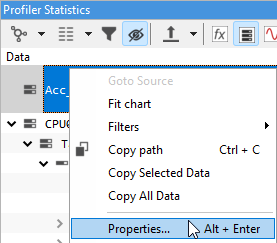
Right-click on the name of the function/data you are interested in and select Properties to display the various statistics available.
Statistic calculation
winIDEA Analyzers measure counts, values and several timing measurements (Period, Net Time, Gross Time ,Call Time and Inactive Time). It display values only.
|
Note that only reasonable values are shown. |

Statistics for functions
The availability of various statistics depends on the:
•Profiler Operation mode (Range, Entry/Exit, Flat..)
•Type of an area that was selected (function, state variable...).
OS Profiling and awareness
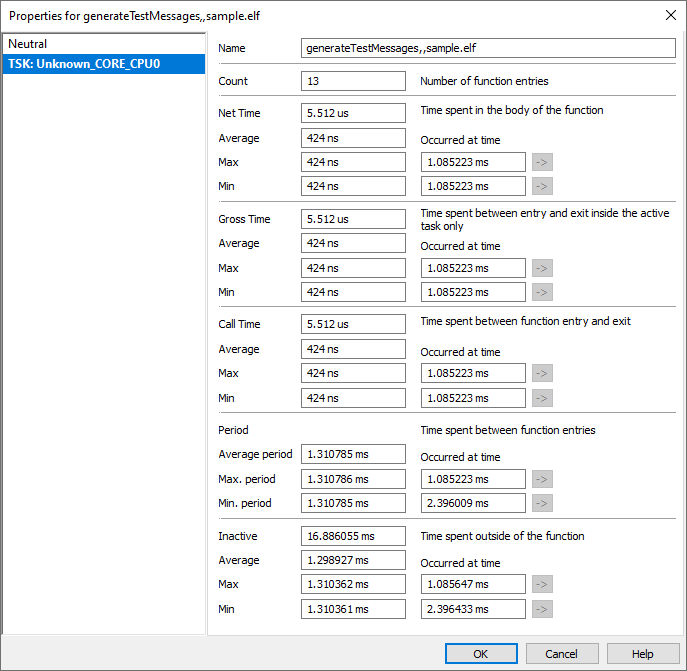
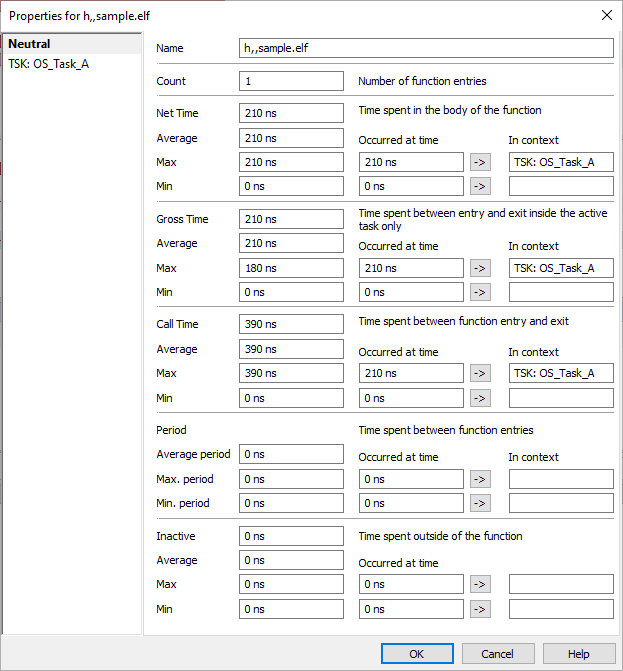
Depending on whether you use an operating system, the Profiler Statistics windows will show a page for each of the detected OS tasks (context). If OS is not in use (or not profiled), only one task will be listed - Unknown. The statistics are calculated for each task separately.
Neutral
Statistics in the Neutral page represent a summary of all Task statistics.
Statistics for regular data variables
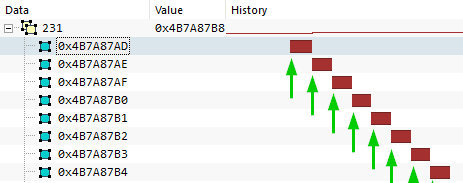
Count
Count displays the number of:
•Function entries (note that the function that is running at time 0ns will only be counted if function entry is recorded at that point)
•Data writes
•State entries
•Task switches
•Task runs
•Other events of interest
depending on the type of Profiler area you are inspecting.
See examples below marked with a green arrows:
Depending on the selected tab/context, you will see:
TSK - Number of events that happened in the context of the specific task.
Neutral - Sum of all events happening in all contexts.
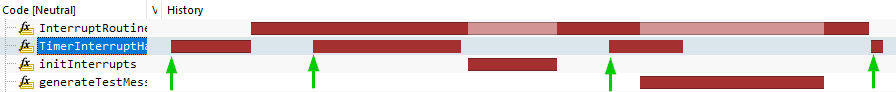
Net Time
Net Time measures the time in which the function / state is active. It is indicated by a dark red color.
See example below marked with a green line:

Net Time - Total active time:
•TSK - Total active time in the context of this task.
•Neutral - Total active time (sum of all task contexts).
Average - Net Time / Count.
Max / Min - Max / min call time.
|
Minimum Net Time only takes into account function calls that are recorded from entry to exit. |
When the function entry or exit is missing from the recording, this function call will be ignored. If the function never enters or exits (typically main function), minimum net time will be shown as 0.
When the function is called recursively, each call is counted separately. NOTE: Maximum number of allowed recursions is limited.
Gross Time
Gross Time measures the time in which the function / state is active or suspended within a task. Ignores the time function spent suspended while other tasks are being executed. Indicated by a dark and light red for all areas, except functions.
See example below marked with a green line:

Gross Time
•TSK - Total active / suspended time in the context of this task, time spent suspended in the context of other tasks is ignored
•Neutral - The total active / suspended time (sum of all task contexts).
Average - Gross Time / Count.
Max / Min - Max / min Gross Time.
|
Minimum Gross Time only takes into account function calls that are recorded from entry to exit. |
When the function entry or exit is missing from the recording, this function call will be ignored. If the function never enters or exits (typically main function), minimum Gross Time will be shown as 0.
|
Gross Time statistic is not available in the Flat Operation mode. |
|
Gross Time for functions is time between entry and exit WITHOUT preemptions where for other areas is time between entry and exit WITH preemptions. |
Call Time
Call Time measures the time between function entry and exit. The time function spent suspended while other tasks are being executed is considered. Indicated by a dark (active) and light red (suspended).
See example below marked with a green line:

Call Time
•TSK - Total active / suspended time, only functions called in this context are considered.
•Neutral - The total active / suspended time (sum of all task contexts).
Average - Call Time / Count.
Max / Min - Max / min Call Time.
|
Minimum Call Time only takes into account function calls that are recorded from entry to exit. |
When the function entry or exit is missing from the recording, this function call will be ignored. If the function never enters or exits (typically main function), minimum call time will be shown as 0.
Period
Period shows the time passed between successive function calls / data writes / task entries.
See example below marked with a green line:

Average
•TSK - Sum of all periods in the context of this task / Count.
•Neutral - Not applicable, if you wish to measure a period over the whole application, disable the OS profiling (to get only one task, Unknown).
Max / Min - Max / min time between entries/writes
If there is only one entry/write available, then the period is not calculated. If the function did not start at the function entry point (usually when trace recording is started after the function is already running), this instance is not used for period calculation.
Inactive Time
Inactive Time shows the time spent outside of this function/state.
See example below marked with a green line:

Inactive time
•TSK - Total time spent outside of the active/suspended state, in the context of this task.
•Neutral - Total time spent outside of the active/suspended state (sum of all task contexts).
Average - Inactive Time / number of inactive occurrences.
Max / Min - Max / min time spent outside active/suspended state, only time between active states is considered.
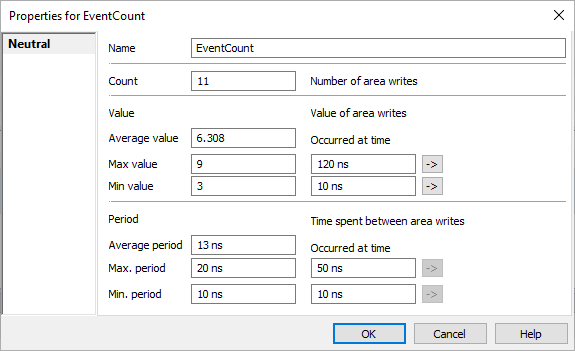
Value
Value statistic is available only for regular variables and all other profiler areas depicted as a regular variable, such as an analog signal value.
Average - Average value of the variable, which takes into the account how long each value was active.
Min / max - Min / max value of the variable.