Analyzer
In this topic:
For general analyzer information refer to the general Analyzer chapter.
Trace
The RH850 family supports three trace interface modes.
•Nexus - Streams Nexus formatted trace messages into an On-chip Trace Buffer, the OCTB. RH850/F1L and RH850/P1x feature 32KB buffer size. RH850/F1H in a bigger package has Nexus trace pins bonded out to overcome the limited OCTB size
•Software Trace - This interface mode streams application instrumentation messages via the LPD debug port pins.
•On-Chip Trace (OCTB and Nexus port) - Based on messages and has limitations compared to the in-circuit emulator where the complete CPU address, data and control bus is available to the emulator in order to implement exact and advanced trace features.
Trace Concept
For program trace, trace port sends a message only for every executed non-sequential instruction, effectively on changes of a program flow. Each message contains the instruction type information and a destination program counter. Based on this information, the debugger reconstructs complete program flow by inserting sequential instructions between the recorded non-sequential instructions. This can work as long as the debugger has a complete code image of the application (download file) in order to know which sequential instructions are located between the non-sequential. For the same reason, a self-modifying code cannot be traced.
Transmitted OCT messages are appended with time-stamp information. That is a time of message, not of execution. All sequential instructions being reconstructed by the debugger, relying on the code image and inserted between the recorded addresses, do not contain exact time information. Any interpolation with the recorded addresses containing valid time stamp can be misleading.
Data trace can record all data access cycles issued by the CPU. However, access to CPU core registers (R0-R31, FEPC, CTBP, etc) cannot be traced, unless the code is instrumented with the SFT processor opcodes.
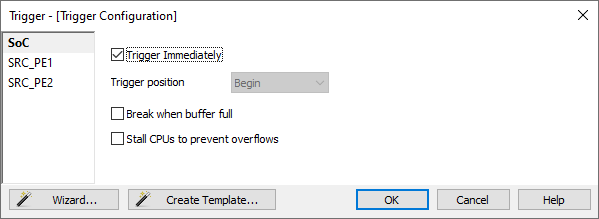
Trace port bandwidth becomes quickly restrictive with the data trace enabled since data trace usually generates 2 messages for a single traced data access. When the number of trace messages exceeds the trace port bandwidth, an overflow message is sent out to inform the user that messages were lost. From that point on and until the next synchronization message, there will be a gap in the trace display. It’s up to the user then to either limit the number of traced data accesses to prevent trace overflow, or to turn on the non-real-time trace mode, which stalls the CPU in order for the trace port to transmit all messages from the internal trace pipeline without loss. The non-real-time trace mode is turned on by checking the Stall CPU to prevent overflows option in the Trigger configuration / SoC dialog. This means that the application execution time may differ, of course.
Operation mode
Before using trace for the first time please refer to the Analyzer chapter to learn more about trace technologies and possibilities. A selection between trace Analyzer Operation modes is done in the CPU Options dialog. Refer to Analyzer Configuration for more information.
Cycle Duration parameter is used for time-stamp calculation in On-Chip and SFT modes, and depends on the MCU core clock frequency. The period roughly matches the core clock. The above example for an 80MHz PLL core clock has been fine-tuned from 12.5 to 13.5ns with an oscilloscope measuring application that was toggling a port pin.
 |
Using OCTB
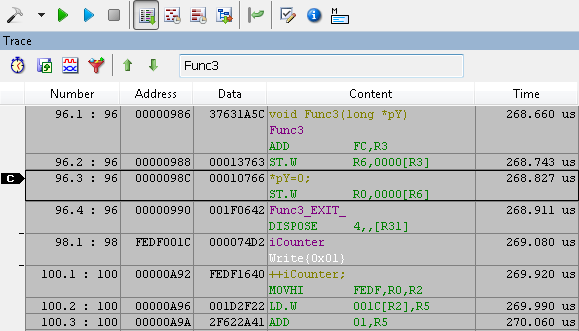
After starting the trace, program execution trace messages are stored to the On-Chip trace buffer, and when it’s full, it is read and decoded to get a reconstructed program flow display.
Using Nexus Trace
After starting the trace, program execution trace messages are sent directly through the Nexus port to the emulator’s trace buffer. The trace recording is uploaded to the PC while the sampling continues. The recording is then decoded to get a reconstructed program flow display.
Trace Operation Mode
Trace based on the RH850 OCTB or Nexus can be used in three different ways:
•Single Shot
•Trigger position
•Continuous mode
|
Single Shot
Where the trace buffer starts recording trace messages and records until the trace buffer gets filled up.
Trace functions this way when the Trigger Immediately option is checked. This setting also overrides any Instruction or Data event configured for Trigger / Watchpoint detection.
Trigger position
Where trace buffer records trace messages before and after the trigger event until the trace buffer gets filled up.
Trigger position setting adjusts the amount of trace buffer before the trigger event and indirectly the remaining part of the trace buffer acts as a post trigger buffer. ‘Begin’ sets 1/16 of the complete buffer before the trigger event (15/16 after the trigger), ‘Center’ sets ½ (1/2 after the trigger), and End sets 15/16 of the buffer before the trigger (1/16 after the trigger). In this mode, trace stops recording after the trace buffer fills up after the trigger event hits. Trace functions this way when configuring one of the available Instruction and Data events for trigger operation (Trigger / Watchpoint option checked).
Continuous mode
Where trace buffer records trace messages until manually stopping the trace or until the application is stopped due to a breakpoint hit. Trace functions this way when no trigger is configured (no trigger event configured and Trigger Immediately option is unchecked).
Stall CPU to prevent overflows
CPU will be stalled if traced data overwhelm device internal trace logic capabilities.
Example Configurations
Below example configurations cover different use cases:
•Trigger immediately - Record complete program execution until the buffer is filled up.
•Continuous mode - Record complete program execution + one data variable until application is stopped by the execution breakpoint hit or trace is stopped manually.
•Trigger immediately - Record one complete function (Address_TestScope) until the buffer is filled up.
•Trigger on a function - Record complete program execution + one data variable (iCounter).
•Record between functions - Record program execution between function 1 call and function two call + one data variable accesses.
Trigger immediately
Record complete program execution until the the buffer is filled up.

Continuous mode
Record complete program execution + one data variable until application is stopped by the execution breakpoint hit or trace is stopped manually.

Trigger immediately
Record one complete function (Address_TestScope) until buffer is filled up.

Trigger on a function
Record complete program execution + one data variable (iCounter)

Record between functions
Record program execution between function 1 call and function two call + one data variable accesses
