Trace Configuration
In this topic:
Right Instrumentation Technique
Hardware tracing relies on the trace capabilities provided by the microcontroller. Depending on the microcontroller, one of the following trace techniques must be employed:
Architecture |
Instrumentation Technique |
Additional Information |
|---|---|---|
Infineon Auurix NXP/ST Power Architecture Arm Cortex-M |
data_trace |
In most cases, data_trace is the best approach. |
Renesas RH850* |
software_trace |
Keep sft_dbtag checked (software trace instrumentation will use the more efficient DBTAG instructions. This attribute is not relevant for other instrumentation types) |
Arm Cortex-M Arm Cortex-R |
stm_trace |
•Configure stm_base_address and stm_channel. •STM base address is device-specific. |
|
*The term RH850 software trace can be misleading, as it actually refers to an instrumentation trace technique that utilizes hardware instructions such as DBPUSH and DBTAG. This technique is restricted to recording traces for only one core at a time, which may limit its application for multi-core applications. |
|
Hardware tracing depends on the capabilities provided by the microcontroller. In doubt, contact the support team if you have questions about the possibilities on a certain microcontroller. |
Infineon Aurix
Infineon Aurix Data Trace
These sections explain how to configure data trace for the Infineon TriCore architecture. The basic configuration for all trace use cases is the same, so make sure to follow the steps in the Basic Configuration section.
Basic Configuration
This section gives you a starting point for more complex TriCore configurations. To create a start configuration, execute the following steps.
|
Select Operation Mode via Hardware / CPU Options / Analyzer / Operation Mode. |

•On-Chip for DAP
•Aurora Trace Port for AGBT
|
Create a new Manual Trace Configuration via View / Analyzer / Create New Configuration. |

|
In the Recorder page: |

a.disable Timer Interpolation.
b.select Upload while sampling when using a DAP.
|
In the MCDS page set: |

a.set the EMEM Trigger Position to Begin.
b.assume timestamp source to be tick.
|
Under the MCX page set: |

a.trace_done to Never.
b.tick_enable to Always.
|
Save the configuration. |

Data Trace Single Variable
Assuming you have a basic TriCore trace configuration, this section shows how to add a data-trace trigger for a specific variable.
|
This section assumes that you have followed the instructions to map the trace variables into global LMU RAM. If that is not the case and you want to trace a variable from core local scratchpad RAM (e.g., 0x7000’0000 address range), replace BOB with POB X and select a specific core. Then, do the trigger configuration under TriCore X (instead of SRI). |
|
Open your Analyzer Configuration and select Configure under Manual Hardware Trigger. |
|
In the MCDS, configure SRI 1 to observe SRI slave LMU0. |
|
Under the SRI, configure data tracing for a specific variable. |
|
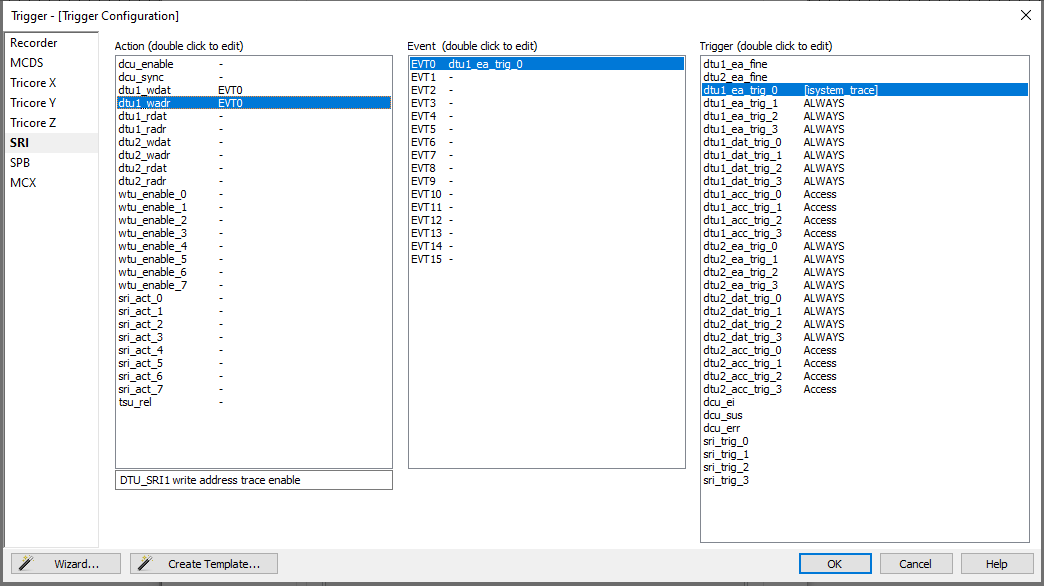
Specify a Trigger for the variable. |
a.Double-click an available dtu_ea_trig such as dtu1_ea_trig_0.
b.Configure the trigger to work as a ranger comparator X <= ADDR <=Y.
c.Select the variable (or address) you want to trace and tick the check box for Entire Object.
|
Find an Event that maps to the trigger, enable it, and tick the respective trigger. |
|
Specify the Action. |
a.Activate dtu_wdat and dtu_wadr for the event you have selected.
b.Set the respective Qualifier on Active, the Level on State, and the event you have chosen in the previous step.
c.Make sure to do this for the data and the address actions.
d.To test this configuration, it’s best to first trace a simple global variable that is know to change (such as a counter), and make sure that the write events appear in the trace output.
The following screen shot shows a working configuration for the variable isystem_trace.
Data Trace Address Range
Recording a data trace for an address range works similarly to the configuration for a single variable. The difference is that you specify two variables or addresses instead of a single variable.
|
Execute the steps from the previous section. |
|
Deselect Entire Object. |
|
Specify a start and end address or symbol. |
•When specifying the range via symbols, the first variable, all variables in between, and the last variable are part of the memory range. The only exception is when the Y variable has a complex data type. In that case, it is necessary to expand the complex variable and select the last element. Otherwise, the chip may not record access to the Y variable.
•Instead of specifying symbols, it is also possible to enter addresses directly into the X and Y fields. Specify the raw addresses in hexadecimal form. For example, 0x0 and 0x70002000 are valid addresses. The Y value must be higher than the X value.
Arm STM Trace
STM is an instrumentation trace technique where writes into dedicated channels that are part of so-called Stimulus ports generate data trace messages. To configure STM tracing, follow these steps.
|
Create a new Manual Trace Configuration via View / Analyzer / Create New Configuration. |
|
In the Trigger configuration menu, open the STM page. |
a.Set STM to Enabled.
b.Change the Port enable mask under Ports with group to FFFFFFFF.
c.Enable Timestamps and set source to SysClk for global timestamps.
The resulting configuration is shown on the following screen shot. Writes to all STM channels are now recorded.

RH850 Software Trace
Renesas Software trace is an RH850 specific instrumentation-based trace technique. It uses dedicated assembly instruction called DBCP, DBTAG, and DBPUSH to create trace messages at points of interest. You can decide where and with which arguments to call the respective instructions.
•DBCP - Creates a trace message with the current value of the instruction pointer,
•DBTAG - Creates a message with a constant value (known at compile time),
•DBPUSH - Creates signals based on the content of variables (that change during runtime).
This section assumes that the application already contains software trace assembly instructions. If this is not the case, refer to the instrumentation trace based sections of this document.
To record software trace messages open winIDEA and the winIDEA Profiler and do the following configuration steps.
|
Select LPD SofTrace under Hardware / CPU Options / Analyzer / Operation Mode. |
|
Create a new Manual Trace Configuration via View / Analyzer / Create New Configuration. |
|
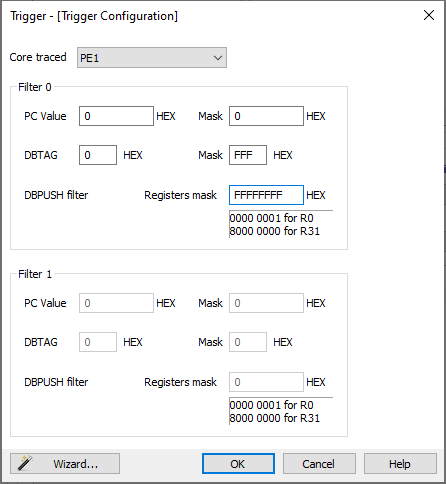
Change Core traced to the core of interest, usually PE1. |
Note that Software Trace can only observe one core at a time.
|
To record all DBTAG messages, set value to 0 and Mask to 0xFFF. |
All value bits are ignored.
a.Usually, you want to record all values, but using value and filter to limit the amount of trace messages can be helpful in case of overflows.
b.See RH850 SFT Configuration for more information.
|
To record all DBPUSH messages, set the register mask to 0xFFFFFFFF. |
The resulting configuration should look as depicted on the following screen shot. The winIDEA Profiler now records Renesas software trace messages. The Profiler interprets the software trace messages based on the information in the Profiler XML file.
NXP/ST Power Architecture
This section explains how to configure data trace for the NXP/ST Power Architecture.
|
Select Nexus Trace Port under Hardware / CPU Options / Analyzer / Operation Mode. |
•PowerPC’s On-Chip trace does not provide sufficient buffer sizes for timing analysis.
•If only On-Chip trace is available, an emulation adapter that provides a Nexus Trace Port may be required.
|
Create a new Manual Trace Configuration via View / Analyzer / Create New Configuration. |
|
In the Recorder page, disable Timer Interpolation. |
|
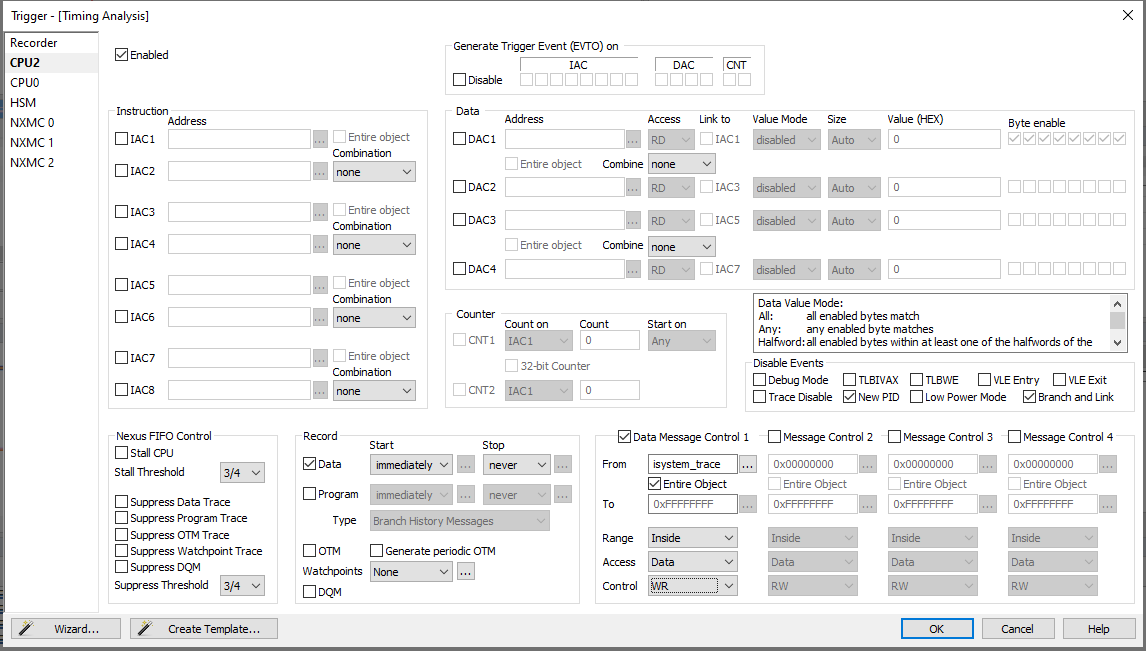
For each CPU on which to record a variable, do the following steps. |
a.Navigate to the specific CPU page.
b.Enable trace for that CPU by checking Enabled.
c.Under Record, deselect Program and select Data.
d.Enable a Data Message Controller and specify the name of a variable.
e.Change Access to Data and Control to WR (i.e., trace write accesses only).
The screen shot below shows the correct configuration to record the variable isystem_trace from CPU2 (which usually is AUTOSAR core 0).