The winIDEA SDK also contains scripts that may be useful during embedded development and debugging.
arraychart
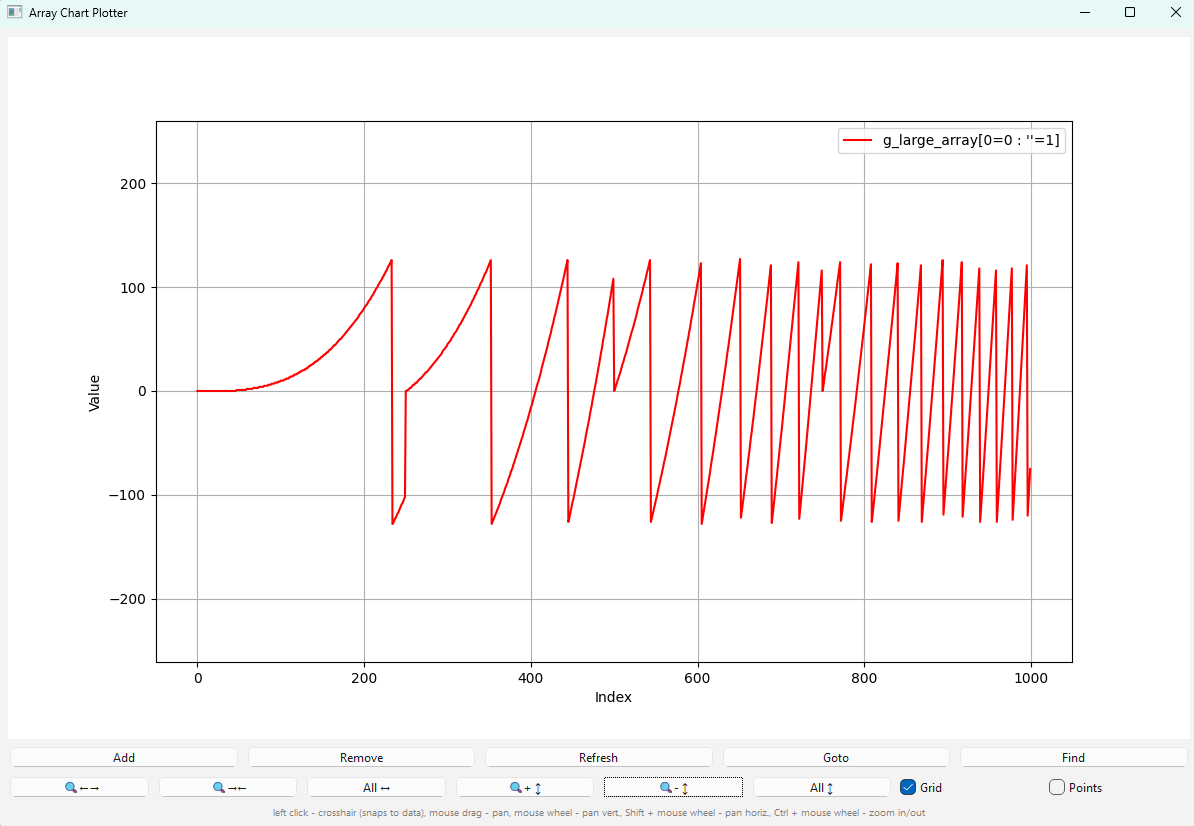
This script plots array contents from an embedded application as a line chart.
Usage
See button tooltips in the GUI for function descriptions. You can also run this script directly from winIDEA by right-clicking a variable of type array in the winIDEA Watch view and selecting the option Show in chart....
Example:
Flamegraph
This scripts creates flame graph as SVG or PNG file, which can be opened in web browser. The SVG graph is dynamic, which means we can zoom it in and out and click on functions to get more info or better view. It takes a winIDEA profiler recording in XML format with timeline as input. Prefer binary timeline export, since file size is much smaller than XML timeline export.
This script is not suitable for long recordings. Additionally, interrupt routines should be filtered out, since they may appear at any point in any stack trace, which makes output image very large and it does not present needed information. Use command line option --ignore to specify interrupt functions.