Coverage display settings
To modify the Coverage display settings click Options button  in the Analyzer Toolbar.
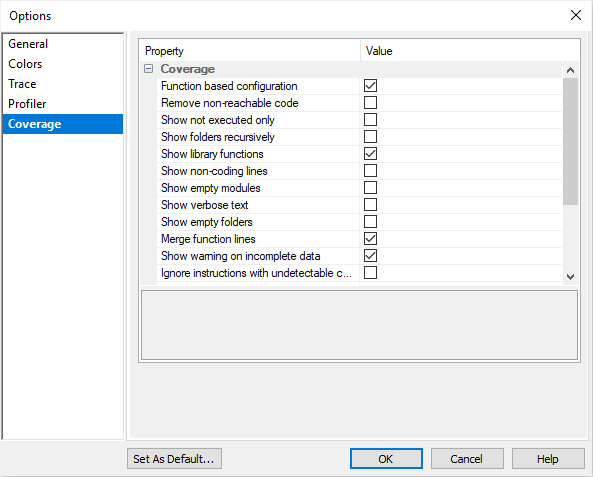
Function based configuration - Keep enabled unless instructed otherwise by the Technical support.
Remove non-reachable code - The code inside the function which is not reachable by sequential or direct branch flow is not considered for coverage statistics.
Show not executed only - Shows only elements (download files, modules, functions, source lines) which include instructions that were not executed.
Show folders recursively - By default all folders are listed on the same level. Enable this option to have them displayed in a recursive tree.
Show library functions - Compiler-added code (e.g. library functions) are considered for coverage analysis.
Show non-coding lines - Show non-coding lines when line-based configuration is used.
Show empty modules - Show empty modules when line-based configuration is used.
Show verbose text - Coverage results in the coverage statistic window are more verbose to ease the result interpretation.
Merge function lines - Some source lines translate to multiple ranges of instructions, as for example for loop (condition check and a branch). Even if the ranges are not consecutive, enabling this option will merge them to ease the review.
Show warning on incomplete data - Warning will be displayed if trace buffer was full before CPU stop was detected.
Ignore instructions with undetectable condition outcome - When information about conditional instruction outcome is not provided in the trace, mark the instruction as non-conditional.
|
Use of this option is not recommended, as it could obscure untested code. All occurrences of such instructions must be manually reviewed for conditional coverage. |

Display mode - By default the statement coverage results on object level are shown in hexadecimal format. Alternatively you can choose to display them in decimal format.
Consider line covered - By default a line is considered covered when all instructions belonging to this line were executed. A more relaxed alternative is to consider the line covered when any instruction belonging to this source line was executed.
File paths - By default the paths are shown relative to the workspace folder. Alternatively you can choose to display absolute paths to the folders.
HTML export - Stores various settings for generating custom HTML coverage reports.
Accumulate results between debug sesisons - Coverage results will not be reset between debug session and will be accumulated.
|
Use of this option is not recommended, as it could obscure untested code. Use of this option is not recommended. If the image on target has been changed between debug sessions, coverage results will be incorrect. |