Analyzer Display Options
To modify general display settings click Options button  in the Analyzer Toolbar.
General
This topic describes how to configure fonts and saving options for Analyzer Recording.
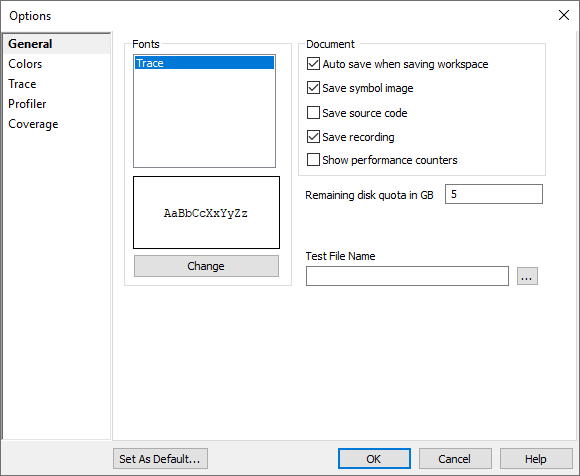
Fonts
Press Change to change the fonts in the Trace window.
Auto save when saving workspace
Check to automatically save the analyzer document when the workspace is saved.
Save symbol image
Save the symbol image in the analyzer file. Necessary when reviewing the analyzer recording and the matching symbol files are no longer available.
Save source code
Save source code in the analyzer file. Option increases the analyzer file size, but is useful when reviewing the analyzer recording where the source files are not available.
Save recording
Save the raw recording to the analyzer file. If disabled only coverage measurements will be saved.
Remaining disk quota in GB
Verify how much disk space you actually have on a system disk or on a disk on which ISYSTEM_TEMP variable points to. In case you don’t have enough free space on system disk, store your temporary Analyzer files on other disk and redirect ISYSTEM_TEMP to point to that folder.
Show performance counters
When checked winIDEA will dump analyzer session analysis performance counters in the Analyzer Output window.
Trace display options
This page allows you to configure Trace Window. Default configuration is considered detailed enough for everyday use, but if required, you can enable additional information.
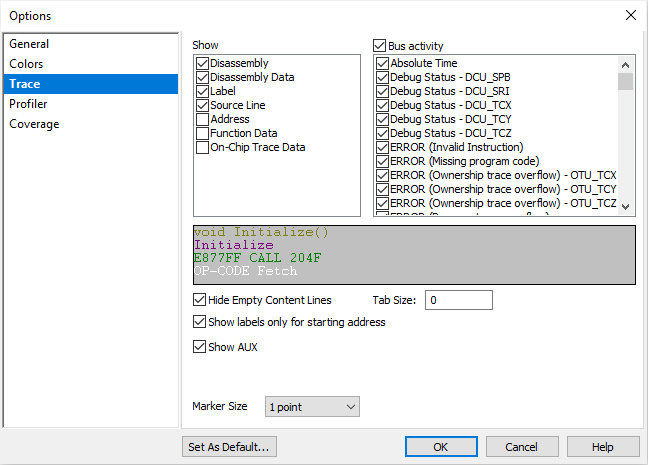
Disassembly
Address flow and op-code data is disassembled.
Label
Address is looked up in the symbol table and if a matching symbol (program functions and their exit points, global code labels, global variables...) is found, its name is displayed.
Source Line
Address is looked up in the symbol table and the source line text is obtained from the source code file itself; If the source file is not found, only the name of the file and the line number is displayed.
Address
Address of the executed instruction, data write etc.
Function Data
Matches function entries and exits to generate a function call tree.
On-Chip Trace Data
For diagnostic purposes to show the raw trace message frames as recorded by the BlueBox. Note the brown frame in the trace example above - this is an example of a raw trace message frame, which was decoded and used to reconstruct the program flow.
Bus activity
Describes the type of the trace activity. Can be used to filter the activity of interest (e.g. display just data writes).
Profiler display options
This page explains how to configure Profiler display settings.
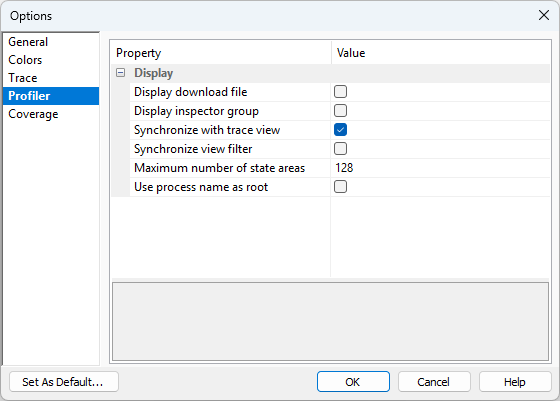
Display download file
If you are using multiple download files where the same variable or function names occur, you can display the download file name together with the area name to easily tell them apart.
Displays Profiler Inspector Group with the area name.
Synchronize Profiler Views
Synchronizes all Profiler views to show the same elements.
Synchronize All Profiler Views Filters
Synchronizes all Profiler views filters.
Max number of state areas
Set limit of allowed data states to prevent excessive memory usage.
Use process name as root
When creating data and code area items, the process name will be used as root item.
Coverage display options
Function based configuration
Keep enabled unless instructed otherwise by the Technical support.
Remove non-reachable code
The code inside the function which is not reachable by sequential or direct branch flow is not considered for coverage statistics.
Show not executed only
Shows only elements (symbol files, modules, functions, source lines) which include instructions that were not executed.
Show folders recursively
By default all folders are listed on the same level. Enable this option to have them displayed in a recursive tree.
Show library functions
Compiler-added code (e.g. library functions) are considered for coverage analysis.
Show non-coding lines
Show non-coding lines when line-based configuration is used.
Show empty modules
Show empty modules when line-based configuration is used.
Show verbose text
Coverage results in the coverage statistic window are more verbose to ease the result interpretation.
Merge function lines
Some source lines translate to multiple ranges of instructions, as for example for loop (condition check and a branch). Even if the ranges are not consecutive, enabling this option will merge them to ease the review.
Show warning on incomplete data
Warning will be displayed if trace buffer was full before CPU stop was detected.
Ignore instructions with undetectable condition outcome
When information about conditional instruction outcome is not provided in the trace, mark the instruction as non-conditional.
|
Use of this option is not recommended, as it could obscure untested code. All occurrences of such instructions must be manually reviewed for conditional coverage. |

Display mode
By default the statement coverage results on object level are shown in hexadecimal format. Alternatively you can choose to display them in decimal format.
Consider line covered
By default a line is considered covered when all instructions belonging to this line were executed. A more relaxed alternative is to consider the line covered when any instruction belonging to this source line was executed.
File paths
By default the paths are shown relative to the workspace folder. Alternatively you can choose to display absolute paths to the folders.
HTML export
Stores various settings for generating custom HTML coverage reports.
Accumulate results between debug sessons
Coverage results will not be reset between debug session and will be accumulated.
|
Use of this option is not recommended, as it could obscure untested code. Use of this option is not recommended. If the image on target has been changed between debug sessions, coverage results will be incorrect. |