Recorder Dialog Reference
In this topic:
Introduction
Recorder is a part of the BlueBox that records the trace data generated by the CPU and offers a few additional configuration options, depending on the trace technology you are using.
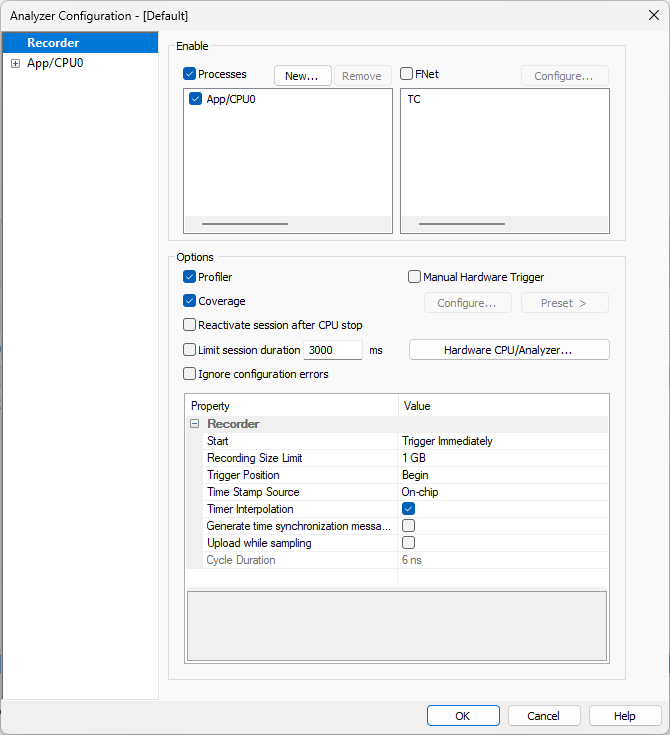
Enable
Processes - Process is listed in the field with an ID, e.g. <Application> | <Memory Space>. Note that if a .trd file is created, all Processes configured in winIDEA are automatically added. For each added Process you get a separate set of Profiler and Coverage pages. What is a Process and how it is defined in winIDEA?
FNet - Refer to FNet Profiling for more information.
Profiler - Enable to view results in the Profiler Timeline.
Coverage - Enable to inspect coverage.
Reactivate session after CPU stop - By default, the analyzer is deactivated when CPU stop is detected. Data recorded is uploaded and analyzed. For a new session you have to manually activate the analyzer again. With this option set, winIDEA will do this automatically once analysis is done.
Limit session duration (Profiler setting) - If you are only interested in events in a short time window, you can limit the session duration. It will continue recording until the profiler analysis reaches the time limit. Once the limit is reached the recording and analysis will be stopped. Note that this option can be used only with the Profiler enabled.
Hardware CPU/Analyzer - Open CPU Options | Analyzer dialog.
Manual Hardware Trigger & Configure - Manual Trace Configuration.
|
When Manual Hardware Trigger is enabled you must correctly configure the trace logic yourself, otherwise it can happen that no trace data will be generated / recorded. |

Recorder specific Options
Start
Select sampling starting point. In continuous mode sampling will be active until CPU is stopped. Specifies when the recorder starts recording the trace data generated by the CPU.
|
This option is not available when on-chip trace buffer is used, as the on-chip logic replaces the recorder functionality. |
Trigger Immediately - This is the default setting, useful when you wish to record all information. Recorder immediately starts recording the trace data and stops recording once the BlueBox trace buffer is full (BlueBox trace buffer size depends on the BlueBox you are using). Trace data is uploaded to the PC immediately and if the amount of generated trace data is small enough, the trace session can last indefinitely (limited only by the Recording Size Limit setting).
On Trigger - This method is most suitable when you are interested in events surrounding a special trigger event. Recorder continuously records trace data, overwriting the old trace data once the BlueBox trace buffer is full. However, nothing is uploaded to the PC until the trigger occurs. Trigger can be configured either in the Profiler page or through manual configuration. Once the trigger is detected, trace data is uploaded to the PC according to the Trigger Position setting.
Continuous Mode - This method is convenient when you wish to see what events led to a certain erroneous moment and you can stop the CPU when this occurs. Recorder continuously records the trace data, ignoring any triggers generated by the CPU. Once the trace session is stopped (either directly or by stopping the CPU), the trace data is uploaded to the PC.
Recording Size Limit
Maximum amount of data to be recorded. Can be less, if debugger buffer overflows. In continuous mode it will never be more than debugger buffer size. This size limits the Analyzer file size on the PC. It should not be confused with the on-chip trace buffer or BlueBox trace buffer size. Once the trace file reaches the recording size limit, the recording is stopped. The option is not visible if on-chip trace recorder is used.
|
Enough disk space needs to be available to store the recording. If the drive with %TEMP% folder is too small, a Windows environment variable ISYSTEM_TEMP can be set to a directory on a different drive, which has more disk space available. |
Trigger position
Select amount of samples recorded before trigger position. Trigger position determines how much of the history (trace data recorded before the trigger was detected) is preserved.
•Begin discards all history and preserves only trace data recorded after the trigger was detected.
•Center preserves some history if it is available (up to half of the BlueBox trace buffer size).
•End preserves all history trace data.
|
Recorder will continue recording as long as there is some BlueBox trace buffer left. Once the BlueBox trace buffer is full it will stop writing depending on the trigger position setting in order to preserve as much history as specified. |
Time Stamp Source (CPU architecture-specific)
Select time stamps source (BlueBox, On-Chip, ITM). Two possible sources of the timer are used with the trace session:
BlueBox timer - Implemented inside the BlueBox and is used if the trace data is acquired on the SoC trace port. On each captured sample BlueBox timer is also stored in the trace buffer.
On-Chip timer (On-Chip Trace Buffer - OCTB) is typically used when trace recording is done inside the SoC. Such systems don’t have trace ports, trace data is acquired internally by the On-Chip recorder. BlueBox will acquire trace data by reading trace RAM through the debug port.
Synchronized recording when On-Chip timer is used
If there is more than one trace (external) source, e.g. SoC and Network trace / ADIO / CAN/LIN or multiple SoCs, each trace source has to use the same timer. If BlueBox timer is used, synchronization is achieved by design. For any other combination, BlueBox must be able to synchronize to the On-Chip trace timer which means that every On-Chip timer message is converted to the BlueBox timer after samples are uploaded from the SoC. In this case Generate time synchronization messages option has to be enabled. Note that you have to use relative timestamps.
Generate time synchronization messages
Enable this option to generate time synchronization messages, which allow winIDEA to correlate the BlueBox time base to the on-chip trace timer domain. This is required if you wish to see how e.g. network messages correlate to your application execution.
Infineon TriCore: This will only apply if Upload while sampling is enabled as well.
Timer Interpolation
By using On-Chip trace protocols, range of samples can have equal timestamp. When this option is "On" winIDEA will use interpolation to compute the time of those samples. Use only when program trace is enabled. When using on-chip trace logic, this means that the CPU prepares packets of trace data which are then either streamed through the trace port or stored to the on-chip trace buffer. Timestamps are either generated by the CPU as occasional trace messages or appended by BlueBox tools once the trace message is received. This means we do not know exact time at which each instruction was executed, but when a trace message was generated. Such trace message contains information about multiple instructions, which means that Analyzer can either show the same timestamps for all instructions or interpolate them between this and the next timestamp. This option is enabled by default, as it improves the accuracy of the profiler results (but you should be aware that these are not accurate times, but approximations).
|
This option should only be used in combination with full program trace. |
Upload while sampling (Infineon TriCore only)
Upload trace data during sampling (even if OCTB is used), which enables longer trace sessions. Trace is uploaded when a trace tile is full, while the trace recording continues while there are empty trace tiles available. Disables trigger detection.
Cycle duration
Depending on the CPU architecture, it might be possible to obtain timing information in the form of CPU-generated timestamps. These timestamps represent the number of cycles since the trace session was started and is later converted to time by BlueBox tools. In order to do so, BlueBox tools need to know what is the Cycle duration of one clock cycle used by the on-chip trace logic. In order to calculate the cycle duration you need to know the on-chip trace timer clock. Cycle duration represents the period of the on-chip timestamp counter, e.g. 25 ns for counter frequency of 40 MHz, e.g.:
•AURIX: MCDS relative timer
•Cortex CoreSight: global timestamp counter
•Configure the Cycle duration setting in Hardware | CPU Options | Analyzer page.
•You can read out the Cycle duration in the AURIX plugin.