Trace Dialog Reference
In this topic:
•Default Analyzer configuration
•Managing Analyzer Configuration List
Introduction
To configure Analyzer, you first have to start with Trace Configuration. You can use the default configuration of create a new one. Open View | Analyzer | Analyzer Configuration.
The Operation mode should already be configured.
Default Analyzer configuration
The Default Configuration is provided by default when new trace file is opened and is used to record application program flow from the application run on.
No further configuration is needed.
Creating new configuration
By selecting View | Analyzer | Analyzer Configuration | Create New Configuration, New Configuration dialog open, where you can configure various Hardware Triggers.
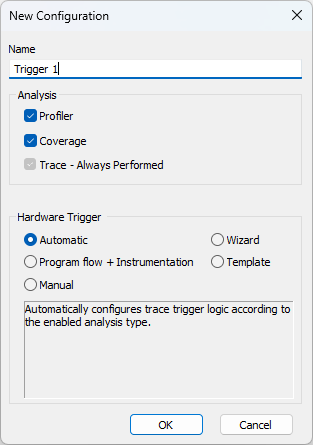
Analysis
Profiler - Enable to view results in Profiler Timeline.
Coverage - Enable to view results.
Trace - When creating a new trace configuration, Trace will always be performed, because it's the basis for the analysis.
Hardware Trigger
•Automatic - Configure the trace settings based on the analysis you wish to perform. winIDEA determines best configuration for desired analysis, while considering CPU trace architecture limitations. By default Analyzer will automatically configure the hardware based on the events you wish to profile, or code areas you wish to measure coverage on. This is the best method for users who are not familiar with specific CPU architecture.
•Wizard - After creating the new configuration, Trigger Wizard is started that enables you to create most commonly used triggers.
•Manual - Manual Hardware Trigger configuration is enabled. The Manual Hardware Trigger Configuration reflects the trace configuration logic and therefore depends on the trace technology used.
|
When Manual Hardware Trigger is enabled you must correctly configure the trace logic yourself, otherwise it can happen that no trace data will be generated / recorded. |

•Program flow + Instrumentation - Trigger is set to record program flow and instrumentation messages.
•Trace Templates - Opens the list of available templates, from which you can select the desired template and modify template’s parameters:
If you wish to use multiple configurations interchangeably, create new additional configurations.
Managing Analyzer Configuration List
If you wish to maximize the use of the Analyzer, you will need multiple Analyzer Configurations, e.g. one for OS profiling and one for coverage measurements. You have two options:
•Create multiple Analyzer TRD files (a bit harder to manage, but allows you to store each Analyzer Recording separately)
•Create multiple Analyzer configurations inside one Analyzer file (keep all the Analyzer Configurations in one file, easier to manage)
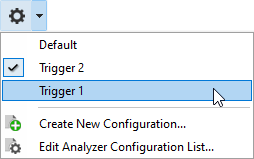
You can view, select, and edit the available Analyzer Configurations in the Analyzer Configuration drop-down menu.
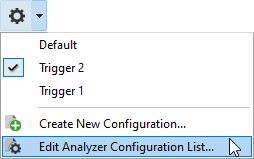
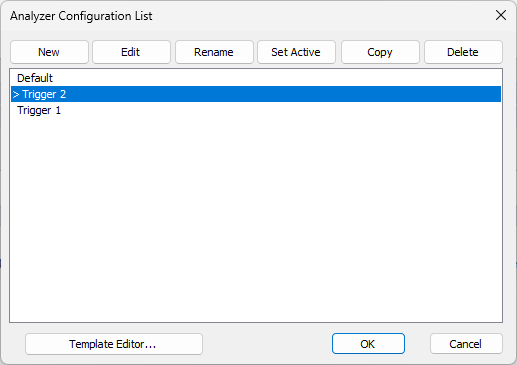
You can maintain the list of the Analyzer Configurations via Analyzer Configuration List.
More resources
•Getting started with Trace - Tutorials