Trace Wizard
In this topic:
Introduction
The winIDEA Trace Wizard simplifies the configuration of common trace scenarios with just a few clicks.
You begin by selecting a Process. Then, you can choose between two trigger scenarios: immediate trigger or triggering upon a specified event, such as data access or code execution. For data access triggers, you can specify the address, object coverage, end address, access type, and data value (width type, etc.).
In the third step, you configure qualifiers and define the information to be recorded, such as comprehensive recording (all data), program flow (all, specific functions, or within a range), data access (all, specific variables, or within a range), and instrumentation messages (OTM/ITM).
After that, you set additional recording filters that refine the recording criteria by specifying samples before and after each qualified event, continuous recording, or recording between two specific events.
Upon completing these steps, you are directed to the Recorder Configuration where you can further configure the recording settings and any additional parameters, such as Recording Size Limit.
Use cases
•Set a simple trigger on an executed function
•Set a simple trigger on a single data access
•Trace only one program range
•Trace only data access to a single address range
It configures all the necessary trace qualification units accordingly.
Opening the Trace Wizard
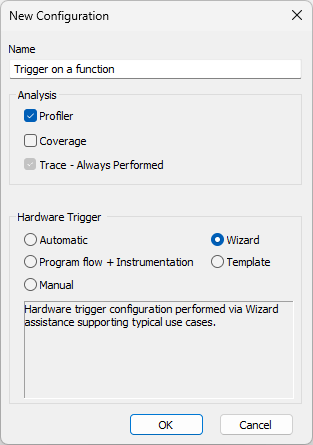
Trace Wizard is accessible in the left bottom corner in the Trigger dialog or by selecting Wizard under Hardware Trigger Configuration in the New Configuration dialog.