Trace
This page allows you to configure Trace window display. Default configuration is considered detailed enough for everyday use, but if required, you can enable additional information.
To modify Trace window display settings click Options button ![]() in the Analyzer Toolbar.
in the Analyzer Toolbar.
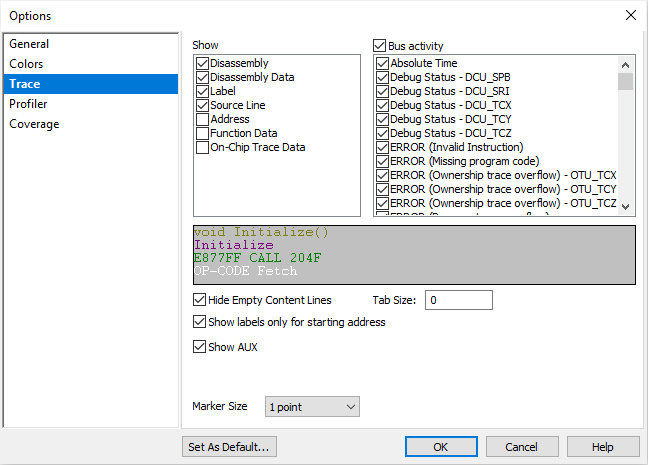
Disassembly - Address flow and op-code data is disassembled.
Label - Address is looked up in the symbol table and if a matching symbol (program functions and their exit points, global code labels, global variables...) is found, its name is displayed.
Source Line - Address is looked up in the symbol table and the source line text is obtained from the source code file itself; If the source file is not found, only the name of the file and the line number is displayed.
Address - Address of the executed instruction, data write etc.
Function Data - Matches function entries and exits to generate a function call tree.
On-Chip Trace Data - For diagnostic purposes to show the raw trace message frames as recorded by the BlueBox. Note the brown frame in the trace example above - this is an example of a raw trace message frame, which was decoded and used to reconstruct the program flow.
Bus activity - Describes the type of the trace activity. Can be used to filter the activity of interest (e.g. display just data writes).