Time/Performance Unit
In this topic:
Introduction
The RH850 Time/Performance measurement Unit (TPU) is a core or a SoC plugin, depending on a device specification.
•The core plugin has 4 Time and 4 Performance counter units. Every core has its own TPU plugin.
•The SoC plugin supports Renesas TMU V4.2 specification and a single TPU plugin has 8 Time and 8 Performance counter units covering all of the cores.
In the simplest example the TMT1 cycle counter can be used to measure time elapsed while the CPU was running. These units offer the possibility of time and count measurements from various sources.
With this plugin you can:
•Measure time (by counting debug clock cycles) with the Time unit •Count events (executed instructions, interrupts, flash accesses...) with the Performance unit •Measure between two events (start and stop condition) •Save the minimal, maximal or last value encountered between several measurement cycles |
•Accumulate results or reset counter on every start event •Set a threshold for a measurement •Break the CPU on counter overflow or threshold violation |
|
The first TPU Time unit of the first core serves by default as a Cycle Counter, if left unconfigured. |

Opening the TPU plugin
To open the plugin you need to have a RH850 workspace loaded in winIDEA. You can then load it through View | [<device>.COREn] RH850 | Time Performance Unit or View | [<device>] RH850 | Time Performance Unit.
Please note shared resources:
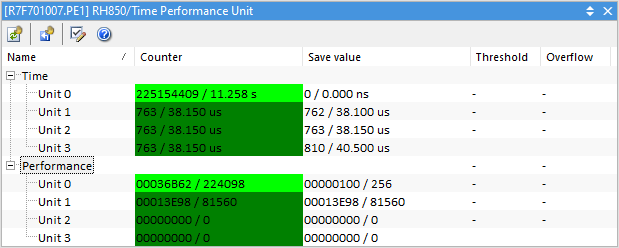
1. After CPU reset winIDEA configures by default the first Time Unit counter of the first core as a Cycle Counter. If the Time/Performance Unit plugin configures that counter, then the default Cycle Counter operation is suspended until the CPU is reset, or if the counter is released, not used anymore by the Time/Performance plugin. This state is visible after RESET in the picture below.
2. RH850 trace and the Time/Performance Unit plugin use the same event-triggering resource.
|
Trace and TPU should not be used at the same time. |
Information is displayed when a debug connection is established.
Toolbar
Button |
Description |
|---|---|
|
Manually update the window |
|
Reset counters |
|
Edit TPU configuration and open the TPU Configuration dialog. Remember to hit Apply Current button after closing the dialog. |
|
Go to winIDEA Help |


Columns
Column |
Description |
|---|---|
Counter |
Values (current) in HEX and in decimal form (HEX / decimal) The currently enabled units are indicated by bright green color. |
Save Value |
HEX and in decimal form (HEX / decimal) |
Threshold |
Status of Threshold Violation (TVF) |
Overflow |
Status of counter Overflow (OVF) flags |
Core |
Core number associated with the Unit (TMU V4.2 spec) in SoC plugin. |