Running Task and ISR Profiling
In this topic:
•Enable ORTI in DaVinci Configurator
Introduction
Running task and ISR analysis works by data tracing the running task and ISR attribute for each AUTOSAR core. The ORTI file specifies two attributes, RUNNINGTASK and RUNNINGISR2, for each core of the application. These attributes point to global variables that can be recorded via data tracing.
The advantage of this approach is that it does not require instrumentation or special configuration via iTCHi.
The disadvantage is that profiling the running object can lead to ambiguous results in the interpretation of the data. For example, if the running task switches from one to another, the reason why the first task stops is unknown to the profiler. This is acceptable for CPU load analysis, but makes other use cases infeasible.
For use cases such as response time requirements verification and event-chain analysis, use a task state profiling approach.
|
Enable ORTI file generation in DaVinci Configurator. |

|
Configure winIDEA to analyze the trace data using the ORTI file and to record all required variables. |

|
Record a trace. |

Enable ORTI in DaVinci Configurator
For OS Task and ISR profiling, you need to enable ORTI file generation in your Vector MICROSAR project. Follow these steps:
|
In DaVinci Configurator, open the Basic Editor. |
|
In the Basic Editor, expand the OS node. |
|
Navigate to the OsOS node and select the OsDebug node. |
|
Activate ORTI Debug Support by selecting ORTI_23_STANDARD or ORTI_23_ADDITIONAL. |

|
Regenerate the OS. |

This process enables the OS ORTI file generation. After generating the OS, you should find a file Os_Trace.ORT in your Appl/GenData directory.

Configure winIDEA
|
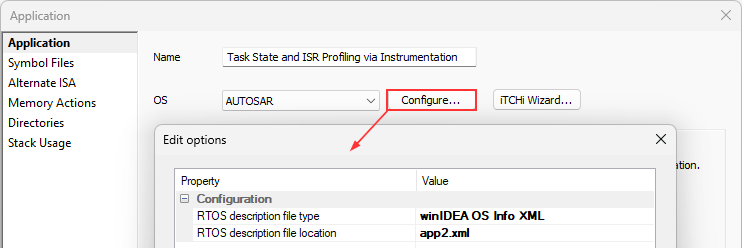
In winIDEA, navigate to Debug | Configure Session | Applications. |
|
Configure AUTOSAR. |
Select ORTI as RTOS description file type and select the previously generated ORTI file in the RTOS description file location.
|
Perform a Download or Load Symbols action to apply the changes. |
|
Create a Analyzer configuration via View | Analyzer | Create New Configuration. |
|
Select the Automatic Hardware Trigger to configure the hardware trace unit automatically. |
Alternatively, you can configure the hardware trace unit manually when you select the Manual Hardware Trigger. Configure data trace comparators for all variables which must be traced (in this use case the variables used for the ORTI attributes RUNNINGTASK / RUNNINGISR2 / STATE).
iTCHi can log all variables that have to be traced by using the iTCHi command line argument --log_trace_symbols.
The trace configuration highly depends on the used microcontroller or SoC. Please check Trace Configuration for more details.
|
Open the created Analyzer configuration and add the Application / Process. |

The application / process has to include all cores that you want to profile.
|
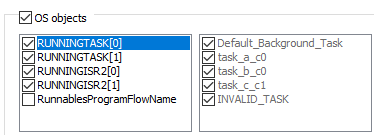
Enable OS Objects and Threads under OS Objects in the Profiler entry from the application / process |

Start profiling
If everything is set up correctly, you should see a trace like the one shown in the screenshot below.
Note that the tasks only have the two states RUNNING and TERMINATED. As mentioned before, this is not sufficient for many use cases where additional states such as WAITING and READY are required.

|
If you don’t see any data or the data does not look plausible, please check the Knowledge Base. |