Start a Debug Session
In this topic:
•Perform Debug / Reset or Debug / Download.
Introduction
This tutorial shows the most common uses cases of starting a debug session with executing a reset or downloading the code to your Target, controlling its execution by using Run Control commands and step through the code.
winIDEA Debug Status in the lower right cornet indicates whether the Debug Session is established and which is the current state of the microcontroller.

Simplified diagram of a Debug Session
Configuration steps

To establish an active debug session, you can:
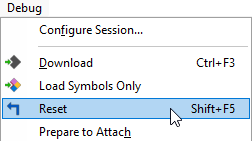
•Perform reset via Debug / Reset or click the Reset button  in the Debug Toolbar, and establish control of the device at its reset point. Within an active session, this will only reset the device.
•Download the executable code and the belonging debug information to the microcontroller via Debug / Download or click the Download button  in the Debug Toolbar and establish control of the device at its reset point and programs FLASH and RAM.
winIDEA will show STOP Debug Status.
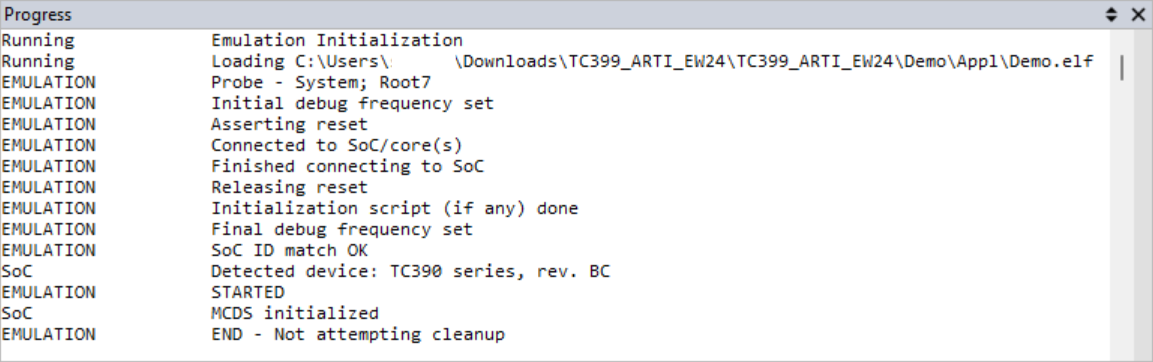
You can observe debug session initialization details in the Progress window.

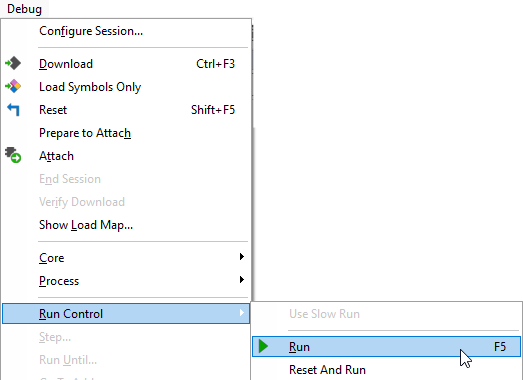
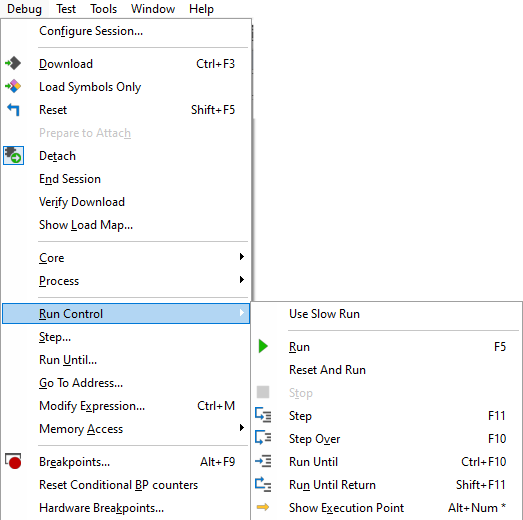
After programming, set the device to Run via Debug / Run Control / Run or click the Run button  in the Debug Toolbar. Run starts or resumes the execution of the application which continuous until the application is:
•Stopped
•Breakpoint is hit
•Other exception / event occurs
winIDEA shows RUN Debug Status.

Follow the Video Tutorial Breakpoint bisecting and see how stepping through the code is used in a real-life example.


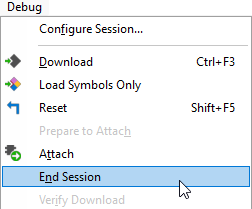
You can end the Debug Session via Debug / End Session.
winIDEA is now disconnected from the BlueBox. winIDEA will show OFFLINE Debug Status in the bottom right corner.
Next steps