System Service Trace profiling
Introduction
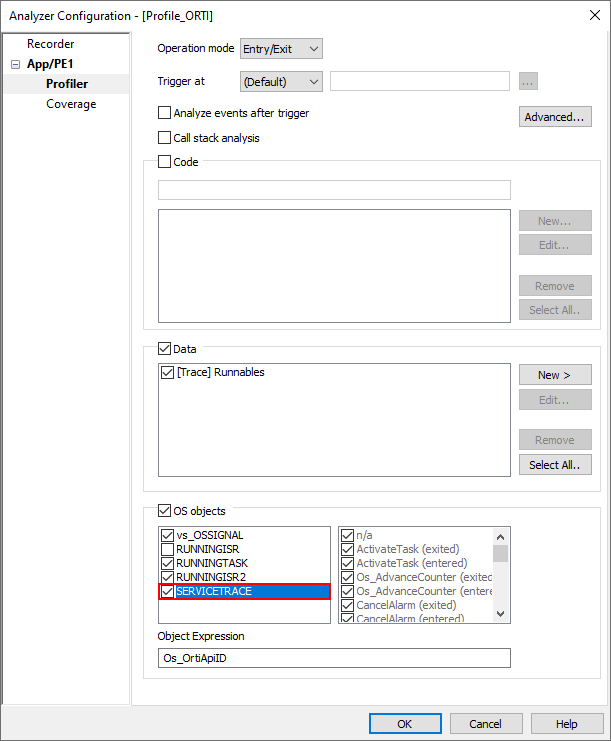
winIDEA supports System Service Trace profiling. The ORTI file is used as a source of information for Profiler configuration as well as Profiler Analysis. This dialog is populated with signals as specified in the ORTI file.
Configuration steps
|
Go to View | Analyzer | Analyzer Configuration | Profiler. |

|
Enable OS objects profiling. |

|
Enable SERVICETRACE. |

|
Since System Service Trace is analyzed as function execution, it is recommended that Tasks are also being recorded along with Service Trace or the results will be different. |
