Code Profiling Dialog Reference
In this topic:
Introduction
If you choose to profile Code, Automatic Trace Configuration will set the trace logic to record the program execution/flow.
|
Make sure that Profiler is checked in Analyzer Configuration | Recorder page. |

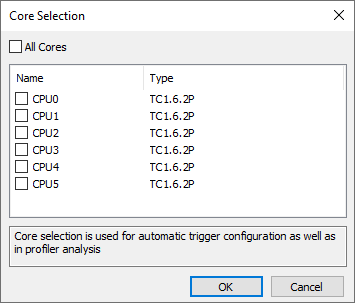
Core Selection
Select those cores via Cores button that you want to be recorded/analyzed. For example, select which cores from the SMP configuration will be used for tracing.
Option All cores is enabled by default, and it automatically configures the trace logic to record accesses from all cores. If you select a specific core(s), only access from this core will be recorded (determined by winIDEA instance in which you start the analyzer).
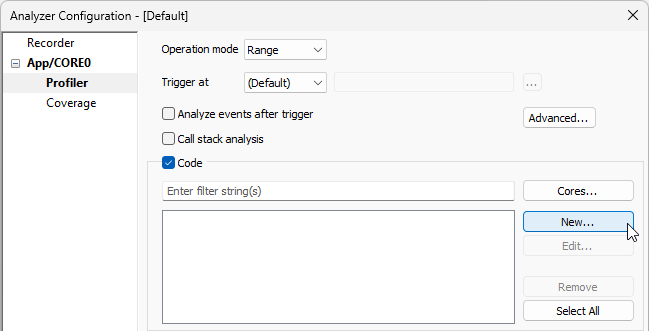
New Profiler Area
The New Profiler Area dialog is opened via New button and it enables adding a new area specify a function or a collection of functions, either in the download file or a specific module. These areas will be used to automatically filter the function profiler results and therefore speed up the analysis.
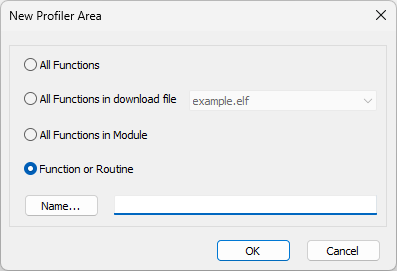
Select an are you wish to profile:
•All Functions
•All Functions in download file
•All Functions in Module
•Function or Routine
Multiple functions areas can be specified with a wild card.
•* - any sequence of characters
•? - any single character
•# - any single digit
•[set] - any of the characters in the set
•[!set] - none of the characters in the set
A set is defined as a sequence of characters. If a dash is used, all characters within the range qualify, e.g. [a-z] defines all characters in range a to z.
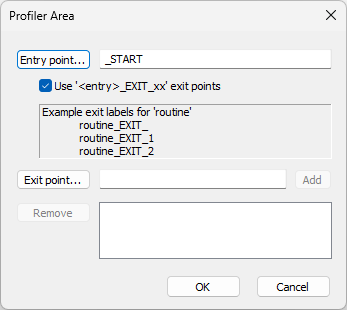
Editing Code Profiler Area
The Profiler Area dialog is opened via Edit button and it enables editing entry and exit points.