Data Profiling Dialog Reference
In this topic:
Introduction
Data trace can not be compressed well and therefore uses a lot of trace bandwidth. Due to this limitation only the specified data areas will be recorded.
Under the Data section, you can configure
•Data Tracing
•Sampling
•PC Sampling
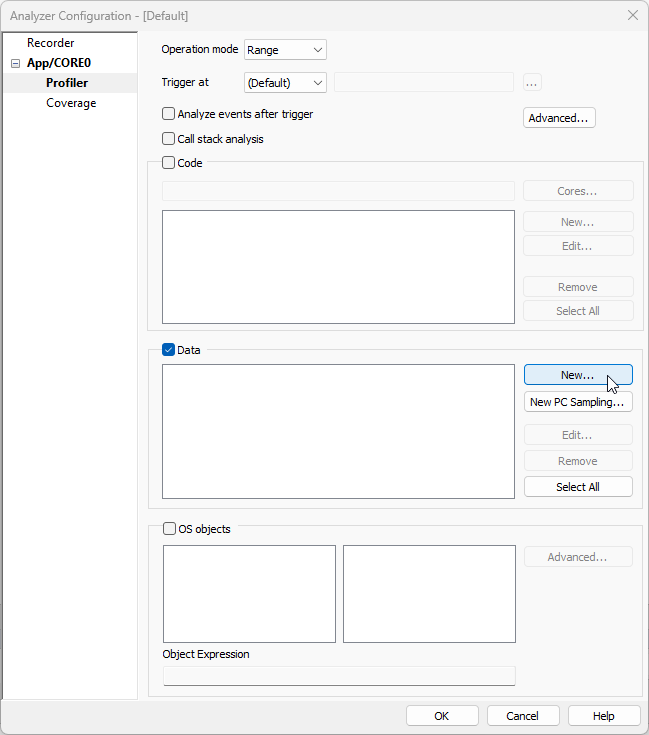
Profiler Data Area
The Profiler Data Area dialog is opened with the New button.
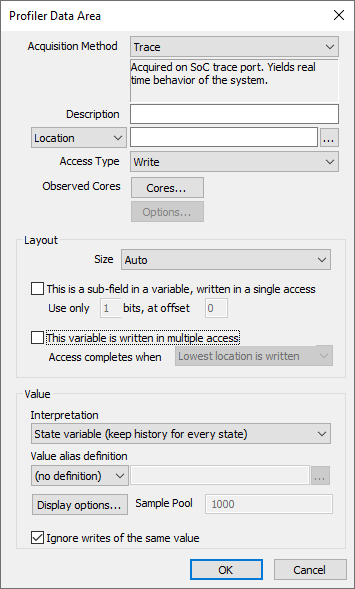
Acquisition Method
Specify the method you want to use:
•Trace - Acquired on SoC trace port and yields real time behavior of the system. Each configured data access is recorded. Trace port can overflow if too many accesses are recorded.
•Sampling - Acquired by periodic read-outs through the debug port. Yields only statistical analysis of the system. Can also be used on the SoC without trace ports.
Description
Specify a meaningful name for the data area. Can be left empty and the Analyzer will automatically generate a name based on the data type.
Location
Specify the name of the variable or an address you wish to monitor.
Access Type
Specify access type you want to view in the Profiler Timeline.
Observed Cores
Cores button opens the Core Selection dialog. Filters out events that come from core that are different from the observed core. The dialog shows all cores in current SMP configuration. If this option is left empty or option All cores is selected, then all cores are observed. You can also select one or more desired cores in the dialog.
Example: Core 0, Core 1 and Core 3 all write in the variable MyVar. Profiler Data Area can be set to show activity only from Core 0 or any other combination of available cores, including all of them.
Sampling interval
Available only when Acquisition Method is set to Sampling. Adjust the speed of Data Sampling:
•Fastest - Data is sampled as fast as possible.
•Normal - Data is sampled after 10ms has passed since the last sample.
•Slow - Data is sampled after 100ms has passed since the last sample.
•Custom - Set the fastest possible change interval of the sampled variable by clicking the "..." button. The sampling period will be set accordingly (at least 30% faster if possible).
Layout
Size - Auto size will select the appropriate size based on the data type you are recording. If the detected size is not correct or you wish to record a specific memory location, you can select the data size manually.
This is a sub-field in a variable, written in a single access - If you are interested only in a part of a data area, you can use this option to specify the sub-field offset and size. Please pay attention to the endianness when specifying the sub-field.
This variable is written in multiple accesses - if the variable is too big to be written in one access, you can enable this option and the analyzer will wait until the last part of the variable has been written to, before it evaluates the value. Set the Access completes when setting based on the order in which the variable parts are being written to the memory.
Value display - Select the way values will be displayed in the profiler results.
Value alias definition - Values written to the variable can have a symbolic equivalent. winIDEA Analyzer can map the literal values to the symbolic names found in an enum type or an include file containing #define statements.
Value
Interpretation:
•State variable - Statistics and timeline are maintained for every value written to this variable. Can be used to profile active task ID. Note that the amount of states is limited by the Max number of states set to prevent excessive memory usage.
•Regular variable - Values written to the variable will be displayed in an oscilloscope format. Useful when profiling the result of A/D conversion.
•Area entry/exit ident by Zero - The values are interpreted as signals of function entry and exit.
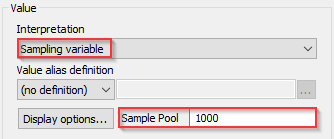
•Sampling variable (Preferred option with Sampling Analysis) - Buffer last Sample Pool amount of samples and display how many samples belong to a specific area in %.
|
If acquisition method is set to “Sampling” it is recommended to use the Value Interpretation Sampling variable and adjust the Sample Pool. |
Display options - Opens dialog Area display to display data various ways (by type, range, name the units etc). Refer to the image below.
Ignore writes of the same value - If consecutive samples with the same values are recorded, count only the first one.
Sample Pool
Applicable only with Data Sampling analysis - Amount of samples used by Sampling analysis. If left blank (default) 1000 will be used.
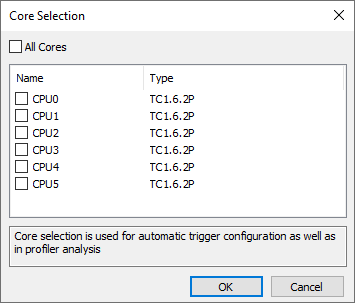
Core Selection
Select those cores via Cores button that you want to be recorded/analyzed. For example, select which cores from the SMP configuration will be used for tracing.
Option All cores is enabled by default, and it automatically configures the trace logic to record accesses from all cores. If you select a specific core(s), only access from this core will be recorded (determined by winIDEA instance in which you start the analyzer).
New Profiler Area
The New Profiler Area dialog is opened with New button and it enables adding a new area specify a function or a collection of functions, either in the download file or a specific module. These areas will be used to automatically filter the function profiler results and therefore speed up the analysis.
If you leave the field, where functions are listed, empty, all functions of the selected application will be analyzed.
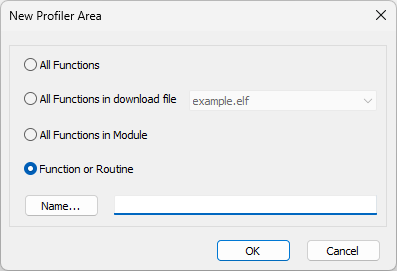
Select an are you wish to profile:
•All Functions
•All Functions in download file
•All Functions in Module
•Function or Routine
Multiple functions areas can be specified with a wild card.
•* - any sequence of characters
•? - any single character
•# - any single digit
•[set] - any of the characters in the set
•[!set] - none of the characters in the set
A set is defined as a sequence of characters. If a dash is used, all characters within the range qualify, e.g. [a-z] defines all characters in range a to z.
Area display
With the Display options button, you open the Area display dialog, where you can configure the way recorded samples are displayed.
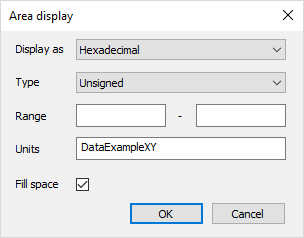
Display data - As Hexadecimal, Binary or Decimal.
Type - Choose a type for the regular variable you are profiling (Unsigned, Signed, Float). This will overwrite the type detected in the debug information.
Range - Minimum and maximum range for regular variables can be specified here. The timeline view will scale the recorded values within this range. If no values are given, the result is scaled to minimum and maximum values detected in the current session.
Units - Specify units.
Fill space - Fill space or Regular variables.
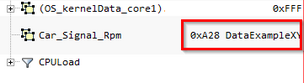
Specified Units
PC Sample Area
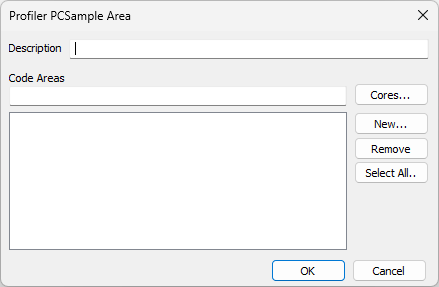
|
You can configure PC Sampling pool via Profiler | Advanced. Amount of samples used by Sampling analysis. If left blank (default) 1000 will be used. Select number of samples in the PC sampling pool field and reanalyze the .trd file. |
More resources
•Profiler Sampling - Overview and limitations