OS Profiling Dialog Reference
In this topic:
•OS Advanced - Context analysis
Introduction
If you are profiling OS objects, the trace settings will be configured automatically based on your OS-awareness settings.
|
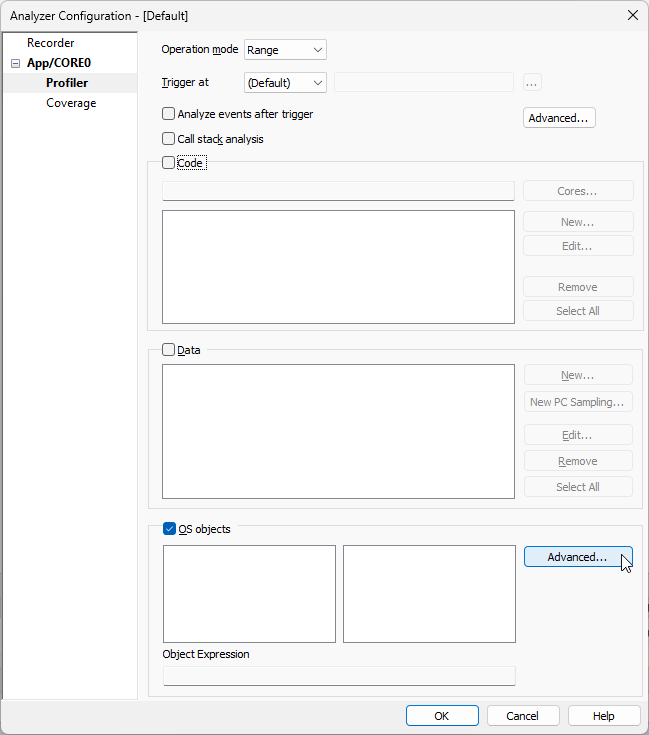
Make sure that Profiler is checked in Analyzer Configuration | Recorder page. |

Navigate to the App/MCU | Profiler page and enable OS objects. You can further control which objects to profile by (un)checking the boxes.
Refer to the RTOS documentation to learn more about OS signaling for your specific RTOS.
Available OS objects that can be profiled - Left window.
Available values for each line in the left window list - Right window.
Each item on the left has its own set of values on the right side. When right window selection changes, content on the left is changed appropriately.
The content of both windows is provided by the OS configuration and is specific to the selected operating system. While you can always disable individual objects on the left, values can be disabled only for certain objects (OS specific).
Advanced - Open the OS Advanced dialog and configure Context analysis.
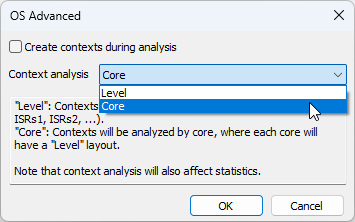
OS Advanced - Context analysis
|
Context analysis will effect Profiler Statistics. |
Create context during analysis
•Not checked (default) - Contexts analysis will be created before analysis
•Checked - Contexts analysis will be created during analysis
Context analysis - Select type of context analysis:
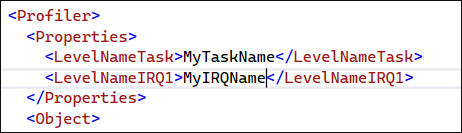
•Level (default) - Context will be analyzed based on their level (Tasks, ISRs1, ISRs2...). Context area is by default named Tasks, ISRs0 to ISRs3. In case you want to rename it, you can do so by specifying properties in your Profiler XML.
•Core - Contexts will be analyzed by core, where each core will have a Level layout.
The Level type is set by default for .trd files.
Example: If you have two tasks objects (one for each core), then these tasks will be grouped together.