Advanced Profiler Dialog Reference
This chapter explains advanced Profiler settings, e.g. OTM / ITM encoding, PC sampling pool etc.
Open Advanced Profiler Configuration dialog to configure the advanced Profiler settings per Process via View | Analyzer Configuration | Profiler | Advanced.
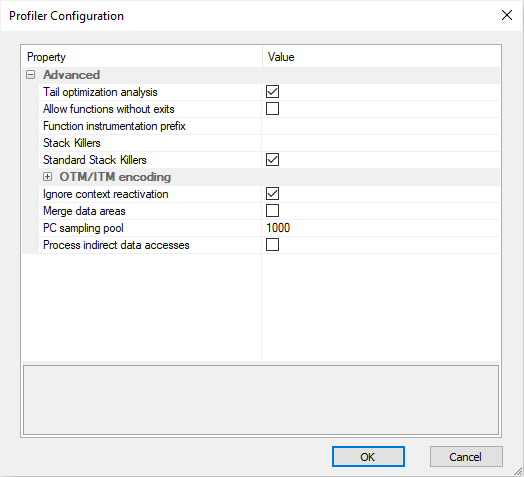
Advanced
Tail optimization analysis
Compilers perform several kinds of optimizations on the function exit code. Profiler must recognize:
•tail-merge, where compiler optimization effectively moves part of function A code body into another function B (e.g. the exit from the function). Execution of function B should therefore be attributed to function A. If the analyzer is not aware of the tail-merge optimization, the exit from function A will instead be attributed to function B.
•tail-call, where optimization occurs when function A calls function B just before it exits. Instead of using a call op-code, a branch is used, so when function B returns, effectively function A returns too. If the analyzer is not aware of tail-call optimization, the function A will never return.
Tail optimization analysis is only possible in range mode. This analysis requires a higher level of debug information quality and it relies on object code analysis. If the analysis algorithm fails, Profiler session aborts. In such case the tail optimization analysis can be disabled to revert to regular range mode.
Allow function without exits
When checked, Profiler allows functions without exits (typically main on embedded applications).
Function instrumentation prefix
If data profiling is used for function profiling via instrumentation, numerical values are used to represent functions. Instrumentation prefix is added to the function name to differentiate between function definition and the definition of the numerical value representing this function. By default it is set to _ipf, which is also the prefix used in examples.
Stack Killers
Functions which terminate the task stack should be specified here. Usually this will be just the central OS scheduler function. If there are multiple, separate them with commas.
Standard Stack Killers
Include standard functions from known OSes which terminate the entire task stack (e.g. osTerminateTask by Vector).
OTM/ITM encoding - Encoding of the instrumentation messages.
Time sorting sample retention - Use this option, when notified in the Progress window.
PC sampling pool - Results of PC Sampling are calculated from last N (1000 by default) events.
Process indirect data accesses - Data accesses made on a location that does not directly reflect the variables are also processed. See two examples below.
Example
From Trace we get information that write to location 0x1000 was made with size of 0x4bytes and value of 0x12345678. In Profiler we configured that we want to observe variable that is at location 0x1002 and size of 0x2bytes
If the option Process indirect data accesses is disabled (default behavior): Write to this location (0x1000) will be ignored since this location is not the same as the location of the variable(0x1002).

If the option Process indirect data accesses is enabled: Variable at location 0x1002 will be assigned with new data. If memory is in little endian, then the variable will have value 0x1234, else 0x5678.
