Get started with coverage Dialog Reference
In this topic:
•Configure coverage display options
Quick start
Enable coverage in three configuration locations, then run a session. Coverage results appear automatically in the Coverage Statistics Window.
1. Check Coverage in Analyzer Configuration > Recorder
2. Define scope and configure the Coverage page (address ranges, modules, source)
4. Run an Analyzer session
5. View results in the Coverage Statistics Window and inspect percentages and inline source markers
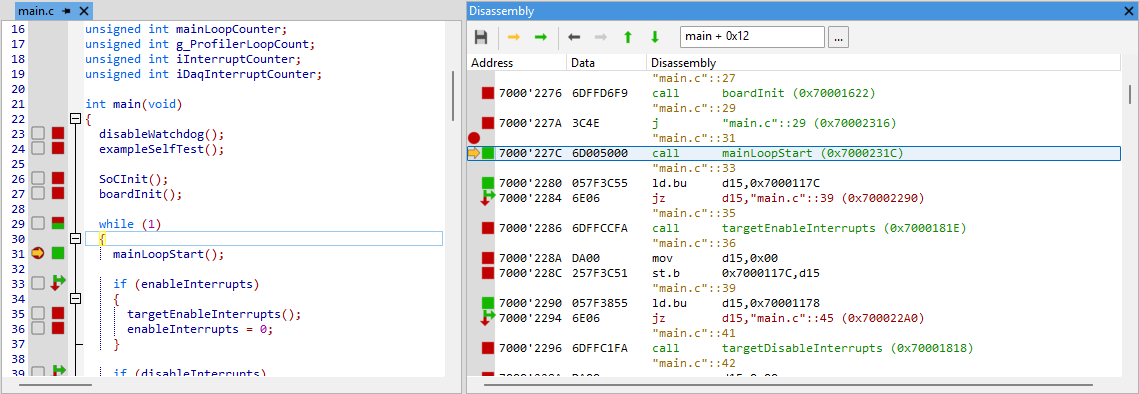
After the session, the Coverage Statistics Window shows statement, function, call, and condition coverage percentages broken down by module and function. Source lines in the Editor are colored green (covered), red (not covered), or mixed (partially covered).
Overview
This guide walks through the complete workflow for enabling and configuring coverage analysis in the winIDEA Analyzer. Coverage analysis measures how much of your application was exercised during an analyzer session without modifying source code or adding instrumentation.
Coverage configuration is split across three locations in winIDEA:
1. Recorder - enables coverage recording for a process
2. Coverage Configuration page - defines which code ranges to include
3. (optional) Display options - controls how results are presented and computed
Before you start
Requirements
•winIDEA with an Analyzer license
•BlueBox debugger connected to the target hardware
•Debug session established (hardware connection confirmed, symbol file loaded)
•Trace technology configured for the target SoC (trace port or on-chip trace buffer)
Dependencies
•The target SoC must support program trace output. SoCs without any trace capability cannot produce coverage data. Refer to Analyzer Operation Mode and Trace Technologies to confirm your trace technology.
•The trace buffer must be large enough to record the code paths you want to measure. For long test runs, a trace port (streaming to BlueBox) provides effectively unlimited depth. An on-chip trace buffer (OCTB) fills up and stops recording once full.
Background knowledge
•If you are new to the Analyzer, read Get started with Trace before this guide.
•Familiarity with what statement, function, and branch coverage mean will help you interpret results — see Overview for definitions.
Steps
Step 1: Enable Coverage in the Recorder
The Recorder controls what data the trace hardware captures and uploads. Without enabling the Coverage checkbox here, the Analyzer never processes program trace events for coverage, the Coverage page settings have no effect and the Coverage Statistics Window stays empty.
1. Open Analyzer Configuration (gear icon) via the Analyzer toolbar.
2. On the Recorder page locate the Coverage checkbox and enable it.
3. Confirm that the correct Process is listed in the Processes field.
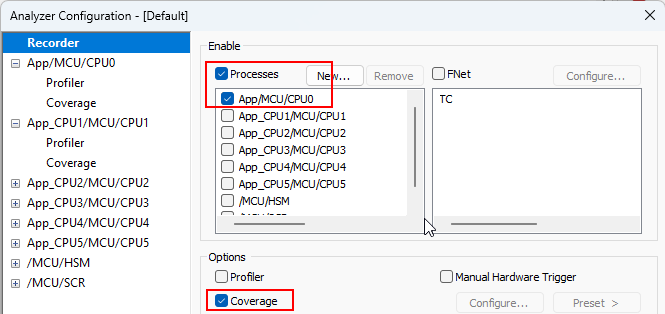
Each Process gets its own set of Coverage configuration pages.
For multi-process (multi-core) targets, enable Coverage and configure the Coverage page separately for each process that requires coverage measurement.
Step 2: Configure the Coverage page
The Coverage page defines the scope of analysis; which address ranges, source files, modules, and folders winIDEA includes when computing coverage percentages. Without configuring this, the default scope covers the entire application including compiler-generated library code, which may inflate or skew results.
1. In Analyzer Configuration, select the Coverage page for the relevant process.
2. Confirm that the Enabled checkbox is checked (it is checked by default).
3. Review the default scope. Coverage results include by default:
•Address ranges (entire application)
•Source code
•Modules
•Folders
Assembler-level information is excluded by default because it significantly increases analysis file size.
4. (optional) Enable the Assembler Information checkbox, if you need assembler-level detail (for example, to manually review object-level condition coverage).
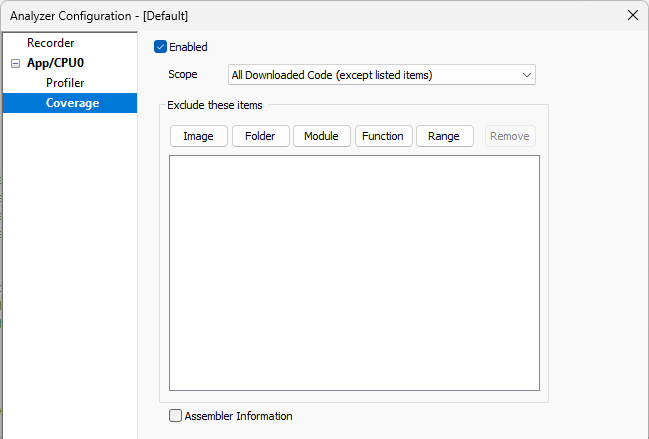
5. (optional) Add explicit address ranges in the configuration, to restrict coverage to specific address ranges instead of the whole application. This is useful when you want to exclude OS, middleware, or third-party code from your coverage report.
Step 4: Start an Analyzer session
Coverage data is derived entirely from the trace recording. The Analyzer must capture program trace events while your application runs in order to know which instructions, lines, and functions were executed. No recording means no coverage data.
1. Establish the debug session and start the application via Debug > Run Control > Run or the Run (F5) button in the Debug toolbar.
2. Click Begin New Session in the Analyzer toolbar to start recording.
The Analyzer Status bar shows SAMPLING (trigger-based) or WAITING (continuous mode).
3. Exercise the code paths you want to measure. Run your test suite, interact with the application, or trigger the scenarios under test.
4. Stop the session:
•Click Stop in the Analyzer toolbar, or
•Let it stop automatically if a stop trigger is configured.
winIDEA uploads the trace data and runs coverage analysis automatically.
|
For on-chip trace buffer (OCTB) targets: if the trace buffer fills up before the session ends, recording stops early and coverage data will be incomplete. The Coverage Statistics Window may show a warning about incomplete data. For longer sessions, use a trace port (streaming) setup instead. Refer to Trace Technologies for options. For detailed session start and stop procedures, including trigger configuration, refer to Start an Analyzer session. |

The Analyzer Status bar transitions from WAITING → SAMPLING → LOADING → Analyzing and returns to blank once analysis is finished. The Coverage Statistics Window populates automatically with coverage data for the session.
Step 5: View coverage results
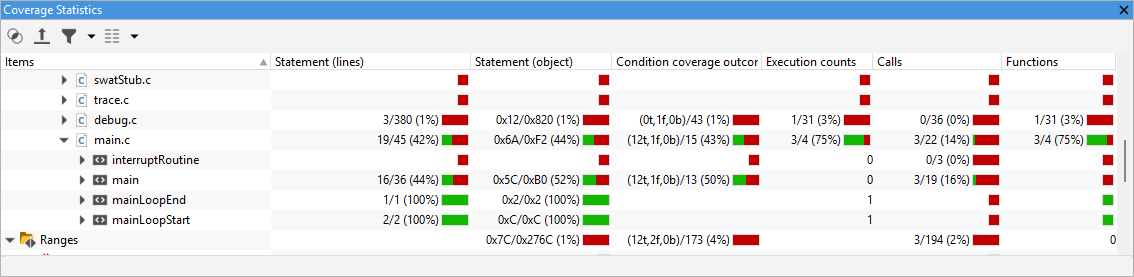
The Coverage Statistics Window is the primary interface for interpreting coverage measurements. It provides a hierarchical drill-down from application level to individual instructions, and shows all coverage types simultaneously.
1. Click the Coverage Statistics button in the Analyzer toolbar to open the Coverage Statistics Window.
Coverage Statistics Window shows coverage percentages per module and function.
a.Expand the hierarchy: address ranges → symbol files → modules → functions → source lines → instructions.
b.Read the key columns.
2. Open a source file in the Editor to see inline coverage markers next to each source line.
Source lines in the Editor are colored:
•green (fully covered)
•red (not executed), or
•mixed (partially covered)
3. Open the Disassembly Window to review coverage at instruction level — especially useful for partially covered lines.
Validate
Run these checks after your first session to confirm coverage is working correctly.
1. Open the Coverage Statistics Window (Analyzer toolbar > Coverage Statistics button).
•Success: At least one module row shows a non-zero statement coverage percentage.
•Failure: Window is empty or all percentages are 0/0 - go to Troubleshooting.
2. Open a source file that was exercised during the session in the Editor.
•Success: Lines are colored green, red, or mixed. The coverage color key is visible.
•Failure: No colors appear in the Editor — confirm the symbol file includes debug information - go to Locate source files for debugging.
3. Check for incomplete data warnings.
In the Coverage Statistics Window toolbar, if a warning icon appears, the trace buffer filled up before the session ended and coverage data is partial. Refer to the troubleshooting entry below.
Next steps
From here you can:
•Export coverage data to HTML, CSV, XML, or gcov format for external reporting - see Coverage Export.
•Accumulate results across multiple sessions by pressing Accumulate Session Results in the Coverage Statistics Window toolbar before starting a new session
•Re-analyze the same trace recording with different display settings by clicking Re-analyze last session (no need to re-run the application)
Configure coverage display options
These settings affect how results are computed and shown
The Consider line covered setting, for example, changes whether a source line counts as covered when all underlying instructions executed (stricter, default) or when any instruction executed (more relaxed). These choices directly affect reported percentages and are not obvious from the UI defaults.
1. Click the Options button (gear icon) in the Analyzer toolbar.
2. Select the Coverage page.
3. Review these key options:
•Function based configuration
•Remove non-reachable code
•Show not executed only
•Show library functions
•Consider line covered
•Ignore instructions with undetectable condition outcome
|
Option Ignore instructions with undetectable condition outcome can obscure untested code paths. If you enable it, every affected instruction must be manually reviewed for conditional coverage completeness |

For a full description of every option, refer to Coverage display options.
Coverage troubleshooting
Coverage Statistics Window is empty after the session
1. Open Analyzer Configuration > Recorder and confirm the Coverage checkbox is enabled. This is the most common cause; if Coverage is unchecked, no coverage events are recorded regardless of other settings.
2. Confirm the Coverage page Enabled checkbox is also checked.
3. Verify the session actually recorded trace data: open the Trace Window and check for trace events. If the Trace Window is also empty, the issue is with trace recording, not coverage — refer to Get started with Trace.
4. Go to Analyzer Configuration > Hardware SoC/Analyzer and make sure the Analyzer Operation mode is set to None.
Coverage shows 0% for all functions
1. Confirm the application actually ran and exercised code during the session. If the SoC stopped immediately after Begin New Session was clicked, no code may have executed.
2. For on-chip trace buffer (OCTB) targets, the buffer may have overflowed before any SoC-stop was detected, resulting in no usable data. Enable Show warning on incomplete data in Options > Coverage to detect this.
3. Check that the address ranges in the Coverage page match the memory regions where your application runs.
If that doesn't work, examine the Trace Window. If it shows trace events but coverage is 0%, the symbol file may lack debug information — rebuild with debug info enabled and reload.
Library functions appear with no source coverage detail
To exclude library code from your coverage statistics, disable Show library functions in Options > Coverage. To include it, leave it enabled — it will appear as object-level ranges without source line detail.
If that doesn't work: If you have source for the library but it is not appearing, verify that the library was compiled with debug information and that the source path is accessible from winIDEA.
Source lines appear as partially covered even though I saw the line execute
This is normal object-level behavior. The compiler often splits a single source line into multiple non-contiguous instruction blocks — most commonly for loop headers (init, condition check, and increment are separate blocks) and short-circuit boolean expressions. winIDEA shows coverage for all blocks associated with a line; if any block did not execute, the line is marked partially covered.
To investigate, open the Disassembly Window and examine which instruction blocks for that line were and were not executed. Refer to Coverage overview for a detailed explanation with examples.
If that doesn't work, enable Merge function lines in Options > Coverage. This merges non-contiguous blocks for the same line, which can simplify the display — though it does not change what was measured.
Multiple Coverage configuration pages exist but only one takes effect
winIDEA uses the first enabled Coverage page per process. If you have multiple pages, disable or remove the ones that should not apply.
Coverage results not updated after changing display options
Display option changes do not take effect automatically. After changing options, click Re-analyze last session in the Analyzer toolbar to reprocess the existing trace data with the new settings. No re-recording is needed.
Automate with winIDEA SDK
Coverage configuration and session control can be automated using the winIDEA SDK. This is useful for running coverage measurements as part of a CI/CD pipeline or automated test framework.
The SDK allows you to:
•Configure the Recorder (enable Coverage programmatically)
•Start and stop Analyzer sessions
•Query coverage results from the Coverage Statistics Window
•Export coverage data to HTML, CSV, XML, or gcov
Refer to winIDEA SDK for available classes, methods, and Python examples specific to Analyzer and coverage control.
See also
•Start an Analyzer Session - trigger options, accumulate mode, and re-analyze workflow
•Coverage Statistics Window - column definitions, toolbar, and accumulate mode
•Coverage Export - export coverage data to HTML, CSV, XML, or gcov for external reporting and certification evidence
•Coverage overview - types of coverage, object-level vs. source-level analysis, certification standards (DO-178, ISO 26262), and how compiler optimizations affect results