Arm Cortex-R PMU
In this topic:
Introduction
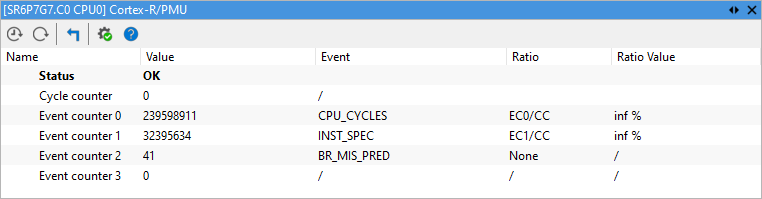
The Performance Monitor Unit (PMU) core plugin displays available performance monitors. These enable you to gather various statistics on the operation of the core and its memory system during runtime; and provide useful information about behavior of the processor that you can use when debugging or profiling code.
The PMU provides a cycle counter and event counters. Each event counter can typically count any of the events in the core. The available events include the architecturally required events (e.g. instructions, data cache hit rate, etc.), some of the common events (counting types of instruction e.g. branch and load/store), and events for counting different types of errors.
Cortex-R PMU supports the following cores: R4, R5, R7, R52.
The plugin can be loaded by selecting View | [<device>.COREn] Cortex-R | PMU. Information is displayed when a debug connection is established.
Toolbar
Button |
Description |
|---|---|
|
Enable automatic update which is indicated by a [Rt] in the plugin title, e.g. CORE0.Cortex-R/PMU [Rt] |
|
Manual refresh |
|
Reset Counters |
|
|
|
Go to winIDEA Help |


Configuration
In the Options dialog you can configure Event Counters and Cycle Counter.
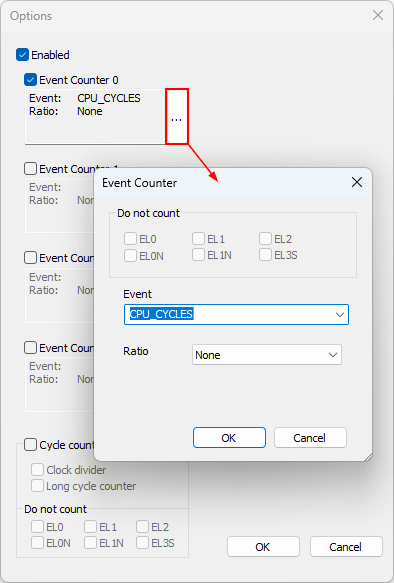
Enabled - Enable the PMU unit.
Event Counter check box - Enable and configure selected Event Counter.
Cycle counter
Clock divider - Check to enable the Cycle divider.
Long cycle counter - Check to enable the Long cycle counter
Do not count - Not counting in selected CPU modes.
Event Counter dialog
Do not count - Not counting in selected CPU modes.
Event - Select an event.
Ratio - Select the ratio between:
•Event Counter n (ECn) and Cycle Counter (CC)
•Event Counter n (ECn) and Event Counter n (ECn)