Coverage
In this topic:
•Types of code coverage measurements
•Practical Considerations of Object Level Analysis
•Code Coverage in Certification
Introduction
Code coverage is a measurement used in software testing, an indirect quantitative measure of test quality. It helps:
•Find areas of a program not exercised by a set of test cases, indicating some code could still contain critical errors.
•Find code that is never executed. So-called “dead code” represents undesired overhead when assigning memory resources and is a potential hazard since it was not tested.
•Identify redundant test cases (that do not increase coverage).
There are several types of code coverage typically performed on embedded projects, depending on the safety requirements for the system:
•Statement Coverage - Ensures that every statement in the application has been executed at least once.
•Function Coverage - Ensures that all functions have been executed.
•Call Coverage - Ensures that all function calls have been executed.
•Branch Coverage - Ensures that each branch of the program has been executed.
•Decision Coverage - Ensures that each decision has evaluated to true and false.
•MC/DC - Ensures that each decision has evaluated to true and false, as well as show that each condition can independently affect the decision outcome.
Coverage Analysis is usually performed on a source code level, with source code instrumentation, which enables the tracking of program execution. BlueBox tools, however, perform the coverage analysis on the object level, without the need for source code instrumentation. Source level coverage is later obtained by aggregating the coverage results of the underlying object code.
Types of code coverage measurements
winIDEA Analyzer provides the following coverage measurements:
•Statement coverage - Ensures that all instructions / statements have been executed at least once.
•Function coverage - Ensures that all functions have been (at least partially) executed.
•Call coverage - Ensures that all function calls have been executed.
•Object level condition coverage - Ensures that all conditions in conditional instructions (e.g. conditional branches) have evaluated both to true and false. This method is commonly referred to as Object Branch Coverage. It can be used instead of Branch Coverage, Decision Coverage and under some circumstances even MC/DC. Note that object level condition coverage is not fully supported in Slow run mode.
Practical Considerations of Object Level Analysis
BlueBox tools show the coverage information for the assembly instructions that were executed. This coverage information is then combined with the debug information which correlates the object code to the source code to produce the source level coverage measurement.
When performing object level coverage analysis it is important to keep in mind, that the CPU does not execute the source code - the source code undergoes a chain of transformations that produce the object code, which is what the CPU is running. For C programs these steps typically include preprocessing, compilation, optimization, assembly, linking and conversion. Based on these transformations the object code might not reflect the source code directly - lines could be moved, changed, removed...
BlueBox tools are able to gain an insight in what is actually executing on the processor - there are no blind spots where untested code could be hiding.
To fully harness the power of the object level analysis, the following points should be understood to correctly interpret coverage information measured by BlueBox tools:
Object code may not directly correspond to the source code
Source level conditional coverage shows aggregated coverage results from underlying object code
Compiler optimizations make object code harder to trace back to the source code
Compilers may include additional libraries provided by the compiler vendor
Object code may not directly correspond to the source code
The object code may not directly correspond to the source code, as a source level programmer might expect.
For example:
1 int i; |
Line 2 is typically split in two or three blocks:
•Initialize the loop
•Check the condition and increment the loop variable
•A tail to cleanup everything after it exits
These two or three blocks are typically located in non-contiguous memory locations. BlueBox tools will show the information for all three blocks merged for the same line. That is why source code lines could be partially covered, even though you have seen it execute - perhaps only some of the blocks were executed.
This is how a loop is shown using BlueBox tools in the source and Disassembly Window:

Source Code

Disassembly Window
If you pay attention to the assembler window, you will see that the for statement is split into two nonconsecutive blocks.
Source level conditional coverage shows aggregated coverage results from underlying object code
Since the coverage analysis is based on the object code, BlueBox tools do not measure the "decision coverage" on the source level as one might expect, but instead aggregate the coverage measurement from the conditional instructions that were generated to test each condition.
For example:
1 if (a == 3 || b ==4) |
Programming languages such as C use short-circuit decision evaluation, which means that as soon as the decision outcome is known, the evaluation of the conditions will be stopped and the execution of the program will continue in the appropriate branch. In the above example it could happen that the first condition already evaluates to true, in which case the second condition will not be evaluated at all (which means line 1 will be marked as not covered). These situations are shown with the greatest possible amount of the detail, so that you can see that some code was not executed even when viewing the coverage results on the source level.
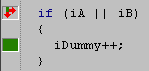
Note how the source code shows the "if" statement as executed (the arrow root is green) but both arrows are colored red. This signals that at least one conditional branch did not evaluate to true and at least one conditional branch did not evaluate to true. Such issues are best analyzed on the assembly level.
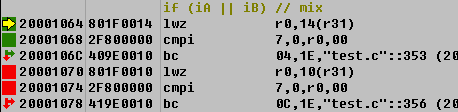
If you drill down on the assembler information for this line you will see that only the first part of the code corresponding to this source line was executed. The first branch condition was true, so the second one was never evaluated.
Compiler optimizations make object code harder to trace back to the source code
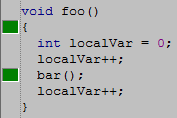
Compilers may merge several source code lines, deem some unnecessary, reorder the execution flow. winIDEA Analyzer shows exactly what is going on. On the source code view of the coverage information you can tell at once if a line of code generates any object code at all.
In the example you can see immediately that some source lines were removed by the compiler:
Compilers may include additional libraries provided by the compiler vendor
BlueBox tools gather coverage information directly from the hardware, which means that all object code is analyzed, with no regard how the code was generated. If source code for the compiler library is not available the information is given on the object and assembler levels only. Full coverage information is still available. Moreover, this doesn't complicate your overall view of the coverage information, as you can:
•configure coverage to ignore library code or
•have the library code be part of your coverage report and use the hierarchical GUI and reports to dig into the parts that you are interested in.
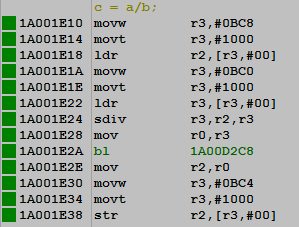
In the following example compiler library is used to implement the division:
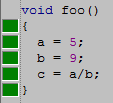
In the Disassembly window you can see that another function (with no debug information) has been called:
However, if you look at the object code of this library function, you will see that it has not been completely tested, as some branches remain not covered.
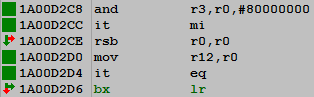
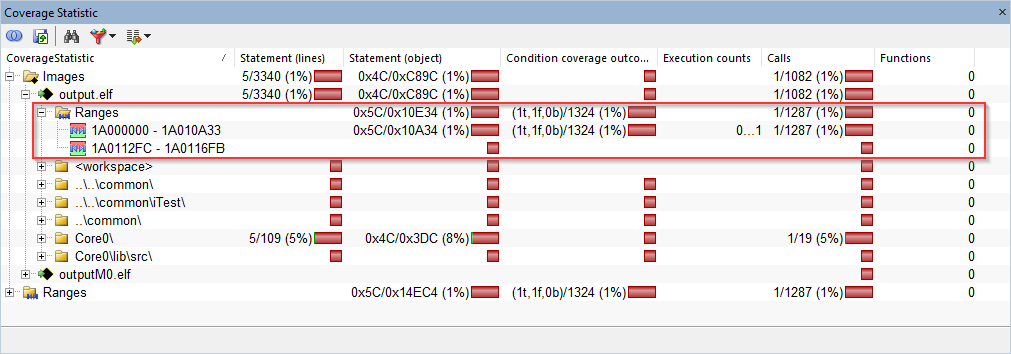
Analyzer will include this code in the coverage analysis and show it as conveniently as possible, depending on the available debug information. In this example there is no available information about this library function, so the coverage information is displayed on the object level only (as ranges encompassing the whole application).
Code Coverage in Certification
Code coverage measurement is a requirement for certification according to standards:
•DO-178B
•DO-178C (Software Considerations in Airborne Systems and Equipment Certification)
•ISO26262 (Functional Safety of Road Vehicles).
Other standards regulating life critical applications point directly or indirectly to code coverage to improve quality, two among these are:
•ISO13485:2003 (Medical)
•SC45A (Nuclear)
If developing a device that will be used in aerospace, automotive, defense, medical, nuclear, railway signaling, mining, oil, safety, etc. it means measuring code coverage during testing is probably required.
Standards typically call for source code level analysis, however the object level approach has been evaluated by the certification authorities and has been used in many projects certified up to the highest safety levels.
Regarding the standards calling for Branch Coverage or Decision Coverage please note that Object Level Condition Coverage is not the same as required by the standard (as both Branch Coverage and Decision Coverage are source code based analyses). Object level analysis is more thorough (will detect all the issues as these methods would and more) and can therefore be used instead of Branch Coverage or Decision Coverage.
Object Level Condition Coverage can be used instead of MC/DC as well, but under certain conditions, which are well described in an FAA paper titled CAST-17, Structural Coverage of Object code.
Code Coverage analysis
Code Coverage analysis is based on the trace recording of the program execution. It provides the following information:
Statement coverage
Each processor instruction is marked as executed or not executed. Object level coverage information is then correlated to the source lines with the help of debug information available in the download file, effectively providing source level statement coverage measurement.
Object level condition coverage
Conditional branch instructions are additionally analyzed to identify if the branch was taken or not, each time the instruction was executed. This produces object code level condition coverage (instruction condition evaluates to true, false or both - true and false). By cumulatively merging the information for each branch four different states are possible:
o the branch was never executed (0% coverage),
o branch condition evaluated to true at least once, but never evaluated to false (50% coverage),
o branch condition evaluated to false at least once, but never evaluated to true (50% coverage),
o branch condition evaluated to both true and false at least once (100% coverage).
Object level condition coverage is then aggregated to the source level information (effectively gathering information about underlying conditional instructions).
On source level one additional outcome is possible, which depicts the state that needs to be analyzed on the object level:
o some instructions were executed, but at least one branch condition never evaluated to true and one branch condition never evaluated to false.
Based on this information offline coverage analysis method can generate all supported coverage measurement types (statement coverage, function coverage, call coverage, object level condition coverage).
|
Note that the offline Coverage Analysis depends on the trace recording. When Running e.g. system tests, it is important that you are able to measure coverage throughout the testing procedure. Since the Coverage Analysis is based on a trace recording, it is important that you are able to continue tracing for a prolonged period of time. Please refer to Trace Technologies chapter to learn how you can achieve longest trace sessions. |
