Debug over XCP Master
In this topic:
•Implementation of the ASAM standard AE MCD-1 XCP SW-Debug in winIDEA
Introduction
winIDEA is an XCP Master running on the host computer. Instead of sending low-level debug commands directly to the target, winIDEA encapsulates those in the form of XCP commands which are send to the XCP Slave on the Plug-on-Device (POD) for further processing.
The debugger software supports almost all winIDEA features provided in a similar winIDEA/BlueBox configuration such as debug, flash, on-chip trace etc.

Implementation of the ASAM standard AE MCD-1 XCP SW-Debug in winIDEA
The new standard (released Nov 2017) defines the concurrent use of both measurement/calibration software and debugger software through a common target hardware interface. The latter is provided as a POD by the measurement/calibration (MC) tool vendor (or from any provider that implements an XCP Slave according to the standard).
The POD connects via a debug interface (e.g., DAP, JTAG) to the target ECU. The communication between host computer and POD is performed via XCP over Ethernet. An XCP Slave running on the POD is scheduling the concurrent use of both worlds, measurement/calibration and debugging.
Requirements
•winIDEA Pro Edition using TLM (TASKING License Manager)
•Supported on Arm, Infineon AURIX TC2xx, TC3xx, Renesas RH850G4 and PowerArchitecture MPC5xxx devices
Supported Measurement and Calibration Hardware and Software
•Vector: VX1000, CANape, CANoe
•ETAS: XETK, INCA
•dSPACE: GSI2, Calibration and Bypassing Service
Configuration steps
|
Communication option is not used when XCP is used for debugging. |

1. Open Hardware | Debugger Hardware | Hardware Type and select XCP.
2. Click on the Configure button and edit...
•Transport - TCP/IP only.
•KeyQueryDLL - Response key for the protection handling. - Not implemented.
•UseBulkAccessIfAvailable - Not implemented.
•Connect Mode - Vendor specific.
oVector - 2
odSPACE, ETAS - 0
•TCP/IP Port - The VX POD TCP/IP port which match to VXconfig port setting. Vendor specific setting:
oVector - 5555
odSPACE - 8671
oETAS - 1802
•TCP/IP Server - The VX POD TCP/IP address. Must match to VXConfig address setting.
Notes
•Debug connection between XCP Slave and the Target must be stable (debug clock not too high, target CPU is powered and not in permanent reset, etc.).
•TCP/IP connection to the XCP Slave must be stable. In case of communication problems, avoid Ethernet switches and connect directly to the PC where winIDEA is running.
•Firmware on XCP Slave must support Debug over XCP.
Integration with Vector
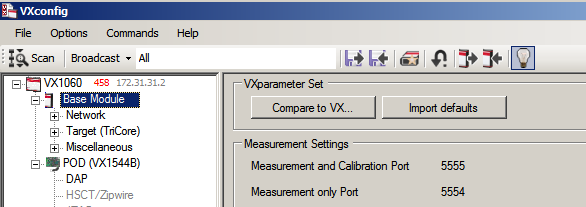
VX1000 shares internal resources between ports 5555 and 5556 (VXconfig port). This means there can be only one connection to (5555 xor 5556). It's recommend to:
1. Use VXconfig when no XCP Master is connected (Canape or winIDEA)
2. Connect Canape or any other DAQ tool on port 5555
3. Connect winIDEA on port 5554 to allow operation in parallel.
In VXconfig you can configure two XCP Slave ports:
Integration with ETAS XCP
This is a general example of how to configure winIDEA to work together with ETAS XCP. Note that each SoC has its own configuration, so you need to adjust the configuration of your SoC on the ETAS XETK Configuration Tool. For more information refer to the ETAS documentation relevant to your use case.
Requirements
•winIDEA version 9.21.348 or newer
•ETAS XETK Configuration Tool
•ETAS XETK Emulator Probe
•ETAS Ethernet Media Converter
Configuration steps
Before accessing an SoC in winIDEA via XCP, a correct configuration must be present on the XETK Emulator Probe. Use the XETK Configuration Tool to adjust and upload a configuration for your target device.
1. Connect to the SoC using the XETK Emulator Probe and Ethernet Media Converter.
Follow ETAS recommendations.
2. In the XETK Configuration Tool, adjust the configuration to your particular SoC and additionally:
a.Set DAP Clock Speed to 50MHz.
b.Enable ECU Watchdog Control.
c.Adapt the Memory Layout according to the application running on the SoC.

3. Upload the configuration to the SoC.
4. In winIDEA, go to Hardware | Debugger Hardware.
a.Select XCP in the drop-down menu.
b.Click Configure.
c.Set the TCP/IP address of the XETK Emulator Probe.
5. Start a Debug Session.
|
If an error is displayed indicating that the RESET pin is not connected, try disabling the RESET pin connected option in Hardware | CPU Options | Reset. |
Logging
XCP commands can be logged in winIDEA.
1. Open Help | Support | Log.
2. Check option 19 (XCP).
3. Click Clear.
4. Click Open.
This is how the debug entry looks:
I 013 XCPImpl: XCP: .................. |