Debugging EVE scripts
In this topic:
Introduction
The primary use case for EVE script debugging lies in the initial phases of silicon vendors' bring-up sites - the development phase for new SoC support. EVE script debugging is integrated into the winIDEA, enabling you to debug scripts related to e.g. System-on-Chip (SoC) initialization.The EVE scripting functionality within the winIDEA, complemented by the BlueBox library incorporates a script engine - GDB server.
Upon configuring an EVE script run for debugging, a new instance of winIDEA is initiated. The main winIDEA orchestrates this process by utilizing winIDEA SDK calls to configure the new winIDEA. These calls incorporate essential settings, enabling the new winIDEA to establish a GDB connection with the GDB server instance. This connection allows the new winIDEA to take control of the EVE script execution within the main winIDEA environment. This approach ensures a debugging environment for EVE script development within the broader winIDEA ecosystem.

EVE script debugging block diagram
|
Refer to EVE Script User's Guide for more information on how to build and run EVE Scripts. |
Requirements
•winIDEA 9.21.221 or newer
•EVE script
EVE Options dialog
You can open the dialog via Hardware | Options.
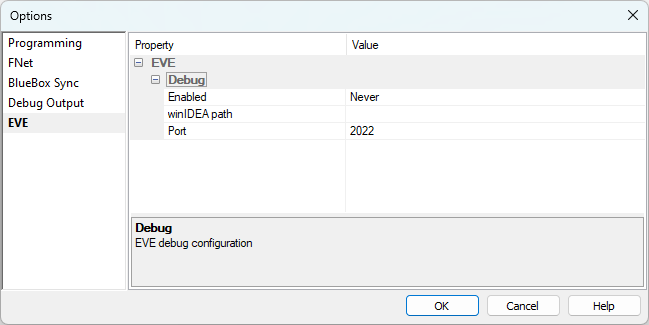
Debug
•Never - EVE Script won't be debugged.
•Always - EVE Script debug session will start for each EVE Script run.
•Optional - User prompt will.
Debugger EXE - winIDEA path to use for debugging (another instance of the current running if left empty).
Debug Port - GDB port to use.