Disassembly
In this topic:
•Stepping through the code at disassembly level
Introduction
Disassembly window shows disassembled object code, which can be navigated with step commands, breakpoints similar to the Editor window. It is particularly useful when no source debug information is available.
You can open the Disassembly window by clicking View | Debug | Disassembly or selecting the Disassembly button  in the Debug Toolbar.
Toolbar
Button |
Name |
Description |
|---|---|---|
|
Save |
Save button opens a save dialog where you can specify the range of addresses that you wish to disassemble and store in a human-readable text file. |
|
Go To Execution Point |
Shows the current execution point in the Disassembly. |
|
Go Back |
Goes back to a previous indicator position. |
|
List from Branch |
Lists the content of the Disassembly window from branch target. This command is available only on direct branches. |
|
List from Start |
Lists the content of the Disassembly window from start of the current function. |
|
List from End |
Lists the content of the Disassembly window from end of the current function. |
|
Address field |
Shows the function and offset of the indicator from the start. |
 |
Browse |
Browse a function and list from its start. |


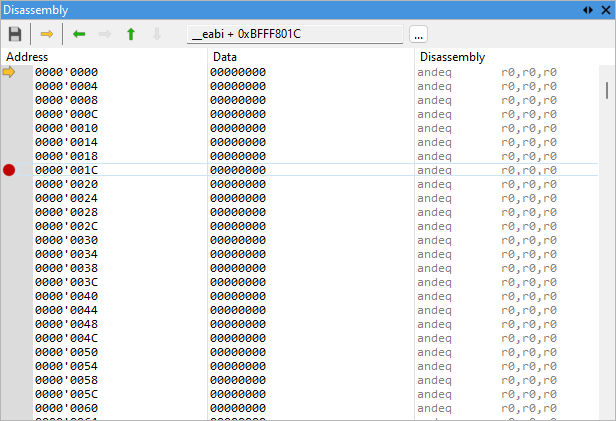
Breakpoints
Breakpoints that have been set in the Editor window are displayed as a red dot. Conditional and change-of-flow instructions are colored differently to regular instructions.
Stepping through the code at disassembly level
Stepping through code at the disassembly level involves examining and understanding the low-level representation of a program's instructions.
By setting breakpoints, you can control the flow of execution and examine the disassembled code at specific locations.
Once breakpoints are set, you can step through the code instruction by instruction. This can be done using commands like Step, Step Over, etc.
While stepping through code, it's crucial to monitor the state of registers and memory. Registers hold temporary data during program execution, and inspecting their values helps in understanding the flow and behavior of the program. Memory inspection allows you to view the contents of specific addresses.
Stepping commands
Step |
Step into the next statement/function - shortcut F11 Step into executes the next instruction in code. |
Step Over |
Step over the next statement/function - shortcut F10 Step over executes an entire function call and stops again when the next instruction after the function is reached. |
Run Until |
Run program until the current/specified position - shortcut CTRL + F10 (or right-clicking Run until in the context menu). Run Until executes a portion of code without needing to set a breakpoint. It navigates you to either the next breakpoint or to the position where you clicked in the disassembly window depending on which one is next in program execution flow. |
Run Until Return |
Run until current function exists - shortcut SHIFT + F11 Useful when examining the execution of the first few lines of a function using Step and then wanting to quickly execute the remainder of the function. |
Context menu
You open the context menu with right-clicking within the Disassembly Window.
Toggle Breakpoint - Sets an execution breakpoint at the current indicator point. If a breakpoint is already set on this location, it is cleared.
Run Until - Sets the CPU running until its execution reaches the current execution point.
Goto - Changes the CPU's program counter register to point to the current execution point.
Goto execution point - Jumps to the current execution point in the Disassembly without executing any code.
List From... - Lists the content of the Disassembly Window from the address selected in Decimal/Symbol or Hexadecimal value.
List Function
•List Function - available when inside a function body. List from function start and beyond function end are provided.
•List Label – available when the outside function body. Lists from the first preceding code label and first subsequent code label are provided.
Points before and after List command are memorized. Reversing the path is possible using the Backspace key.
Goto Source - opens the related source code in the text editor, if available.
Display Information
The Disassembly window always displays disassembled instruction, but you can additionally instruct it to display:
•Source - if a line symbol's address matches the address of the disassembled instruction, the source line is displayed before the instruction.
•Labels - if a code label's address matches the address of the disassembled instruction, the name of the label is displayed before the instruction.
•Symbols - if an absolute location is addressed by an instruction and that address matches a global variable or a code label, the symbol's address is displayed instead of the value.
•Symbols Values
Save - Opens a dialog where you can specify the range of addresses that you wish to disassemble and store in a disk file.
Auto Fit - Adjusts the width of columns to fit the content into the available space.
Options - Provides access to the dialog that allows customization of the Disassembly Window where you can select colors and fonts.
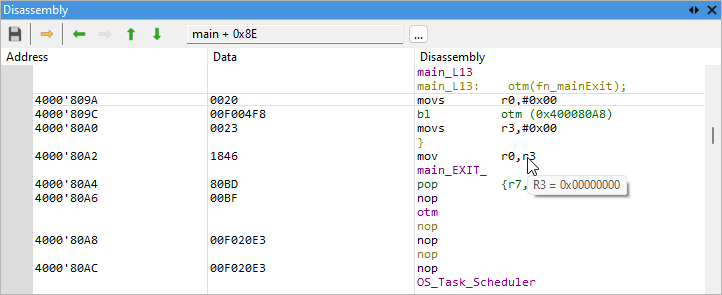
Tool tips
When hovering over a register its value is displayed in a tool tip.