Views
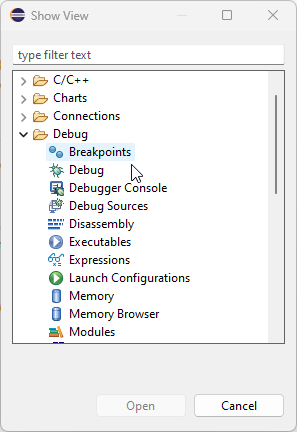
In addition to CDT debugging view, TASKING Debugger also provides 3 special views:
To open this views select the main menu option Window | Show View | Other | Debug | <View>.

Special Function Registers
The SFR view is added to the Eclipse workbench. SFRs are grouped in several groups. If a group which contains SFRs, or SFR which is composed of groups of bits, is selected, the detailed information is displayed in the details pane.
Real-time Expressions
When the target is not in the suspended state, Eclipse does not display the information about the target state, because it is normally not accessible. However, BlueBox hardware may enable you to observe global variables also during the running state (real-time access).
Disassembly
The Disassembly view shows the loaded program as assembler instructions mixed with the source code for comparison.
Start debugging session without downloading the code
If downloading is slow, for example due to slow flash programming, and you know that the code did not change since the last debug session, you can switch off the code downloading. If the toolbar button is pressed, only symbols are downloaded when the debugging session starts. The button has toggle state – each click reverses its state.
Launching without debugging
If you want to run the application without the debugger, you can do it by executing one of the Run commands. In this case, the plugin tries to get the output file name from Eclipse. The output file name is available only if you use managed build in Eclipse. The output file name is specified in project properties: C/C++ Build / Settings / Build Artifact, fields Artifact Name, and Artifact extension. If an output file is not found in the Eclipse project, you have to add output files manually to winIDEA.
Making copies of project
If you want to copy project files to other locations, you have to move all source files and project files. In case of Eclipse with CDT and TASKING debugger, the following files have to be copied:
•.project and .cproject – Eclipse and CDT project files, contain information on how to build the project
•<winIDEAworkspaceFileName<>.xjrf – winIDEA workspace file contains hardware configuration