Multi-core PC Sampling
PC Sampling is analyzing each core separately and is displayed for each context separately.
Select a core
A core can be selected via Current task drop-down in the Profiler Timeline window.
•Neutral - All cores are merged and displayed in one timeline.
•PCS: CPU Name - Context for a specific core.
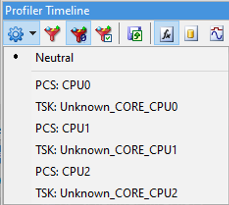
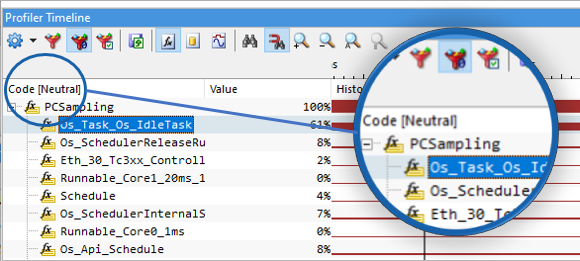
Neutral - All
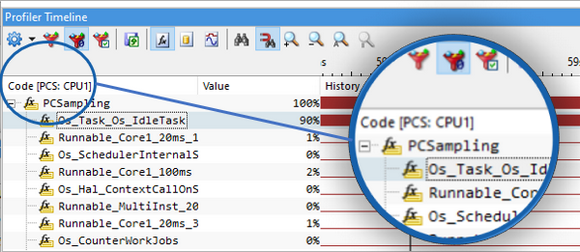
PCS (PC Sampling) CPU1 selected
Example
If function A is running on core 1 10% of the time and on core 2 40% of the time, you would see in the Neutral context that function A was executing 25% of the time. (core 1(%) + core 2(%) + core N(%)) / N. Same as for trace statistics is calculated for each context separately, and neutral statistics is calculated upon them.
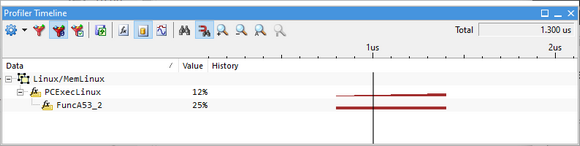
If you have multiple processes running on the same core, the top PC Sample area would show how many samples (in %) belong to this process.
If you would sample a PC on a Linux process, you would also see how much time Linux was executing the process. Process PCExecLinux was active 12% of the time and within this 12% it was executing function FuncA53_2 for 25% of the time. 75% of the time was spent in unknown functions.