Task/ISR Profiler Sampling
In this topic:
Introduction
Profiler Sampling can help you get an approximation of your Task and ISR load based on sampling (periodically reading) the Running Task and ISR variables if OS and RTE profiling is not feasible because hardware tracing is not available.
Following these steps you can get OS metrics without instrumentation and use iTCHi to create a winIDEA OS Info XML.
|
Running Task and ISR Sampling does not guarantee exact metrics like hardware tracing. Instead, you get an approximation that becomes more accurate the longer you sample but might have systematic errors, for example, when an ISR executes for very short durations. |

Configuration steps
iTCHi version iTCHi 8 Jun 2021 or newer is required.
|
Create a default iTCHi configuration file. |

a.Generate an empty one itchi.json with the --write_default_config flag. Refer to iTCHi Basic Configuration for more information.
b.Your itchi.json file should now look as shown on the following listing:
{ |
|
Make sure to set the Analyzer Operation mode to None via Hardware | CPU Options | Analyzer. |

|
Run iTCHI with the --running_taskisr_sampling flag. |

|
Add the generated XML to Debug | Configure Session | Applications | Edit. |

|
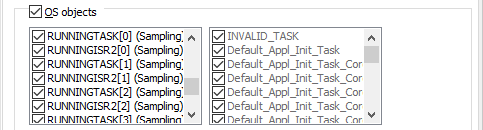
Select the Running Task (Sampling) in Profiler OS objects. |

Select OS objects - Running Task/ISR objects with (Sampling) at the end.
|
Begin a New Analyzer Session. |

Task and ISR sampling data for the selected OS objects.
Results
