OCTB / Nexus Trigger / Qualifier
This trace operation mode is used, when it’s required to trace the application around a particular event or when only some parts of program or data have to be recorded. In practice it turns out to be the most important defining meaningful trace qualifiers, especially due to the fact that On-Chip trace buffer is 32 Kbytes only.
On-Chip/Nexus Trace supports 8 execution and 8 data (access) events.
Execution and Data event configuration
Main switch and sub-switch
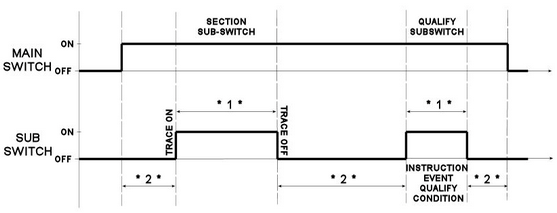
RH850 on-chip trace is built around two control switches (the main switch and the sub-switch), which both together control the trace operation.

|
* 1 * and * 2 * are explained later on under the Qualifier explanation. |
The main switch controls start and stop of the trace operation. When the main switch is on, the trace function operates and outputs trace messages by detecting trace factors. Main switch is directly controlled by the debugger. When winIDEA Analyzer is started, main switch is set to on and when the analyzer is stopped, main switch is set to off.
The sub-switch controls switching between factors to trace while the main switch is on. The sub-switch is invalid when the main switch is off. Section sub-switch and qualify sub-switch are logical OR combined. The sub-switch is on when either the section sub-switch is or the qualify sub-switch is ON.
Sub-switch state
Sub-switch state can be altered by execution and data events. In first step, you must configure Execution and/or Data event(s) which define under what condition(s) sub-switch is switched to ON.
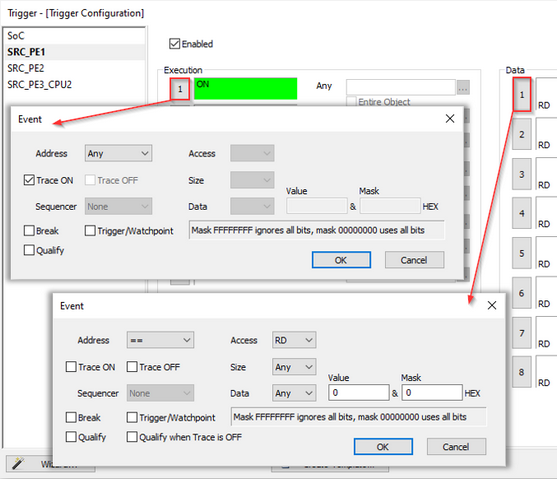
Press the highlighted button  to configure the event action in the Trigger Configuration dialog, section Execution and Data.

Execution Trace ON event (section sub-switch)
When the event is detected, the (section) sub-switch is switched to ON.
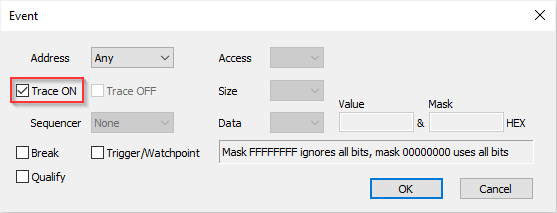
Execution Trace OFF event (section sub-switch)
When the event is detected, the (section) sub-switch is switched to OFF.
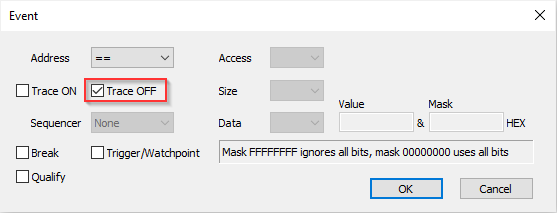
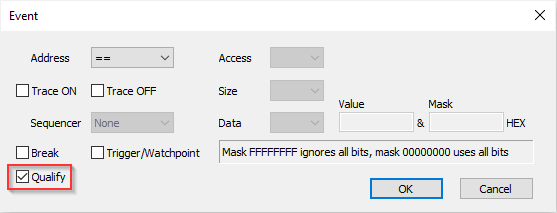
Execution Qualify event (qualify sub-switch)
While a qualify event (in range) is detected and valid, the (qualify) sub-switch is switched to ON.
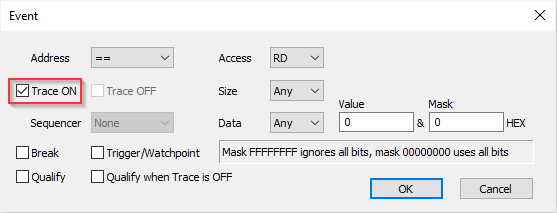
Data Trace ON event (section sub-switch)
When the event is detected, the (section) sub-switch is switched to ON.
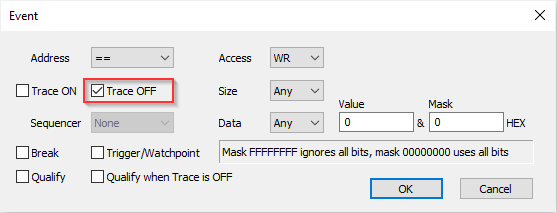
Data Trace OFF event (section sub-switch)
When the event is detected, the (section) sub-switch is switched to OFF.
Qualifier
Qualifier defines what application information (e.g. execution code, data accesses, dedicated debugging instructions, etc.) is traced. It acts as a filter and is linked to the on-chip trace message control, which controls which information is being traced that is stored in the on-chip trace buffer. By recording only the information of interest, a limited on-chip trace buffer (32kB) can be used more effectively. When comparing to the complete program trace, a longer session time is captured when tracing for instance only certain part(s) of the application.
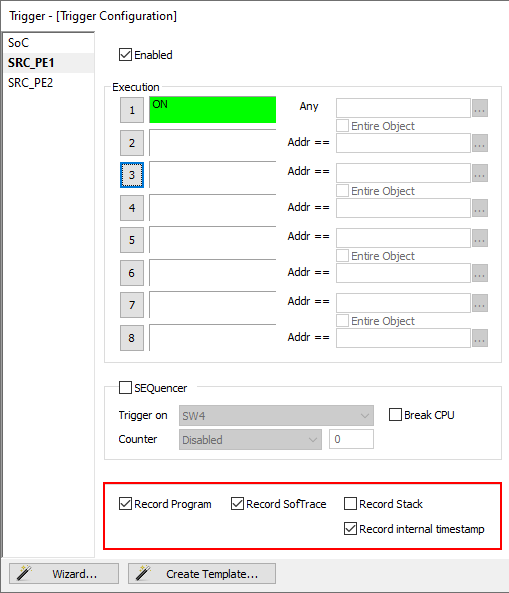
When the sub-switch is in the ON state, the trace can:
Record Program - Records program flow.
Record SofTrace - Records debugging instructions DBCP, DBTAG, and DBPUSH.
Record Stack - Controls whether or not data accesses based on the stack pointer (sp,r3) are traced.
Record internal timestamp - Turn off with OCTB to record more trace samples; with Nexus trace internal timestamps are not recorded, regardless of this setting)
Record data access - Access address, data and size.
Record data access tracing
Data access tracing is configured through one of the eight data events.
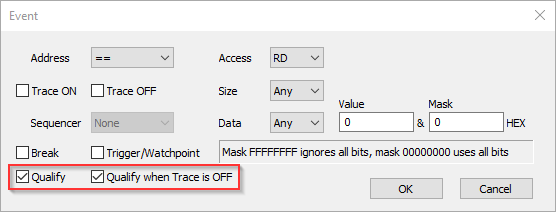
Qualify - Must be checked and an address or a range, which should be traced while the sub-switch is ON, defined.
Access type, Access size Data value - Configurable.
Qualify when Trace is OFF - This option must be checked and the event configured when data needs to be traced while the sub-switch is in the OFF state. When both options are checked, data accesses that match the configured criteria will be traced, regardless of whether the sub-switch is in ON or OFF state.
Record Program, Record SofTrace, Record Stack and Data Event
Qualify - This setting controls and define what is recorded in the trace buffer while the sub-switch is ON (* 1 * area on the left picture).
Data Event
Qualify when Trace is OFF - This setting controls and defines what is recorded in the trace buffer while the sub-switch is OFF (* 2 * area on the left picture).
Break on event
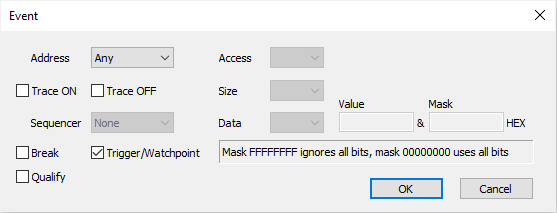
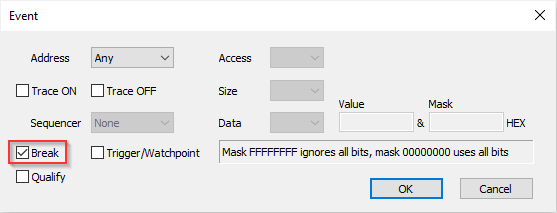
To stop the application on a certain event, check the Break option within Instruction and Data event configuration dialog.
Trigger/Watchpoint
The On-Chip trace buffer is quickly used up when starting trace with the application program start. Configure a trigger event when the target application needs to be traced around a certain event only.
First, the Trigger / Watchpoint option must be checked in the Instruction or Data event configuration dialog and then the trigger event criteria itself configured.
When more than one trigger event is configured, or they are combined, the trace will provide insight into the application behaviour around the trigger event which occurs first.
