Session Explorer
In this topic:
•Observing a not observed core
Introduction
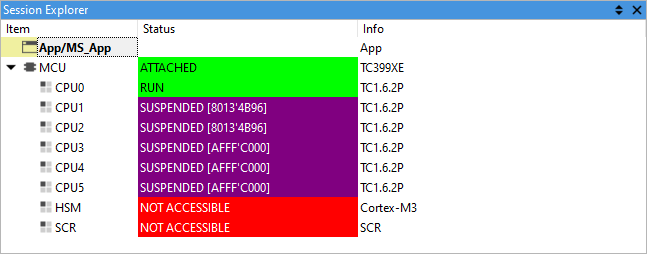
Session Explorer displays Process(es) and SoC(s) with their cores.
To open the Session Explorer window select View > Debug > Session Explorer.
Processes
All Processes are listed with their URLs. The currently focused Process is displayed in bold.
The focused process can be changed either by double-clicking the desired process or by selecting Set Focus from the context menu.
Columns information
Info
The Info column indicates:
•Application that is loaded in the process
•SoC device type
Status
The Status column indicates these SoCs states.
Status |
Description |
|---|---|
DETACHED |
The debugger is not attached to the SoC. |
ATTACHED |
The debugger is attached to the SoC. |
NO POWER |
The device has no power. |
RESET |
The device is actively held in reset. |
ATTACHING |
The debugger is attempting to attach to the device. |
The SoC (MCU) entry expands to show all cores on the device. For these, the Status column indicates the following states.
Status |
Description |
|---|---|
NOT OBSERVED |
winIDEA is not observing the core. The core can be observed by selecting Observe from the context menu. |
HALTED |
The core is halted by the target. |
IDLE |
The core is ready to execute on a specific event (IRQ). |
SUSPENDED [PC] |
The core is halted by SoCs core-synchronization mechanism. It will run automatically when the stopped core is ran. The current PC value is shown. |
RUN |
The core is running. |
STOP [PC] |
The core is stopped by a breakpoint or the debugger. The current PC value is shown. |
Run Duration
The Run Duration column indicates how long each core has been running.
For more information, refer to Measure core run duration.
Run duration values include measurement uncertainty and may use prefixes:
•< value - Actual duration is smaller but cannot be measured precisely
•~ value - Approximate value
•No prefix - Value is rounded based on measurement uncertainty
•N/A - Measurement not available
Switching between cores
You can double-click on a core to select it for debugging. The action is equivalent to invoking the following menu commands:
•Debug > Core > CPUn
•Debug > SMP > SMPn
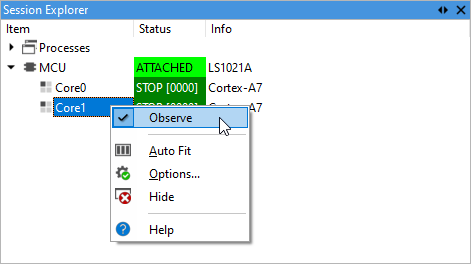
Observing a not observed core
To observe a not observed core, navigate to a CoreN (Item column) with the NOT OBSERVED status. Right-click and select Observe.
You can observe/not observe a core by enabling/disabling option Automatically observe this core in Hardware > CPU Options > Cores.
FAQ
I followed the instructions and the Run Duration for my core is N/A (not available)?
Check if you:
•have winIDEA Pro license in Tools > Licenses
•selected the right BlueBox debugger in Hardware > Debugger Hardware > Hardware Type. Run Duration measurement is only available for iC7 BlueBox family.
•your selected the option to not observe the core in Hardware > CPU Options > Cores
More resources