Software Trace Tool (SWAT)
In this topic:
Introduction
The Software Trace Tool (SWAT) enables recording of trace events by using efficient instrumentation without dedicated on-chip hardware trace logic. The resulting trace data supports use cases such as CPU load analysis, evaluation of task, ISR, and Runnable performance metrics, as well as monitoring arbitrary events such as data writes, and function entries and exits.
For configuration details, refer to the following chapters:
Requirements
The supported operating systems, architectures, and compilers are currently limited to the following:
Hardware requirements
•Any supported target device (see SWAT Release Notes)
•iC7pro / iC7max BlueBox
Software requirements
•winIDEA with Pro license
•SWAT Add-On license enabled
•Sufficient free target RAM for the SWAT buffer (typically 1-4 kB depending on observed event rate)
Integration requirements
SWAT integration requires a skilled engineer familiar with:
•build system configuration
•linker configuration
•application source code structure
SWAT Package Contents
The SWAT package contains:
•SWAT target code (core implementation)
•integration examples for reference
To set up Software Tracing, integrate the provided source code into your application. If you don’t have the Target code package, contact Support to request it.
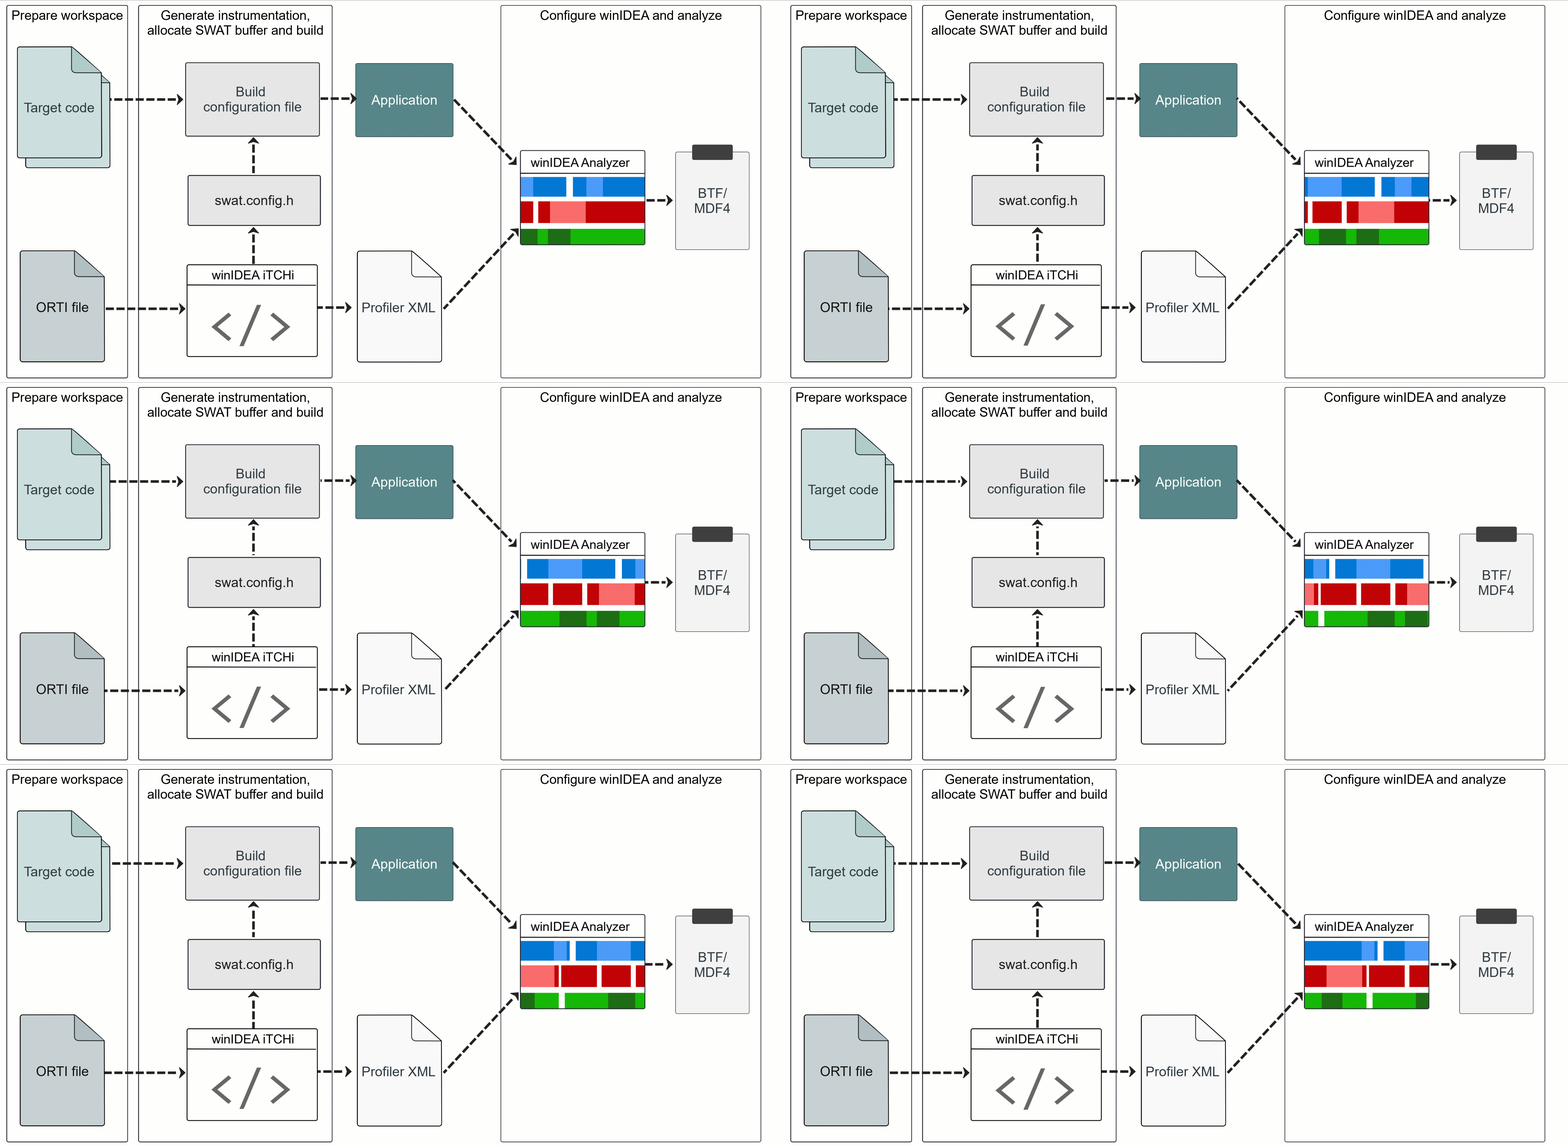
The following steps are required to use SWAT:
1.Application instrumentation
2.SWAT configuration
oiTCHi Wizard
oAllocation of SWAT buffer
3. Build
4. winIDEA configuration

Simplified diagram of the SWAT concept
Special use cases
Synchronized trace
See Synchronized trace.
Recording between arbitrary points
SWAT signals can be used to measure the time between two points in the application, for example:
•Execution time of a code block
•Propagation delay between modules
•Latency from interrupt to task execution
See Recording between arbitrary points.
Supported setup scenarios
Detailed setup instructions are available for:
•Bare metal (no operating system)
•AUTOSAR-based operating system
oMICROSAR
oETAS RTA-CAR
•FreeRTOS
•SAFERTOS
Note: The bare metal setup describes profiling of arbitrary signals. This can also be combined with OS task profiling.
More resources
•AUTOSAR Classic Profiling - Overview
•Profiling Vector MICROSAR - How-to guide