Setting up winIDEA SWAT for bare metal
In this topic:
•Step 1: Configure iTCHi Wizard
•Step 3: Allocate the SWAT buffer
•Step 4: Integrate and rebuild the code
•Step 5: Configure winIDEA Analyzer
•Recording between arbitrary points
Introduction
This section describes how to integrate the SWAT into a bare metal application and configure winIDEA Analyzer to record and analyze trace data.
A bare metal application runs directly on the SoC without an operating system.
Step 1: Configure iTCHi Wizard
The iTCHi Wizard generates:
•Profiler XML configuration for winIDEA
•SWAT configuration header file (swat_config.h)
•Supporting header files
1. Open Debug | Configure Session... | Applications | Edit.
a. Select AUTOSAR (or any of the operating system) as OS (this will enable the iTCHi button).
b. Click iTCHi Wizard...
2. Configure parameters:
•iTCHi Configuration file: Path to the file which is used to load/save iTCHi configuration.
•ORTI file location: Not applicable, leave empty
•Profiler XML file location: Path where Profiler configuration should be written into
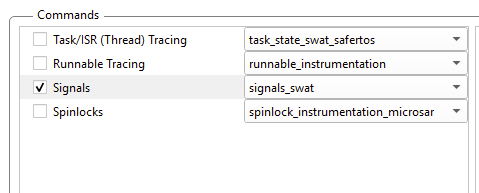
•Commands:
oEnable Signals and select signals_swat.
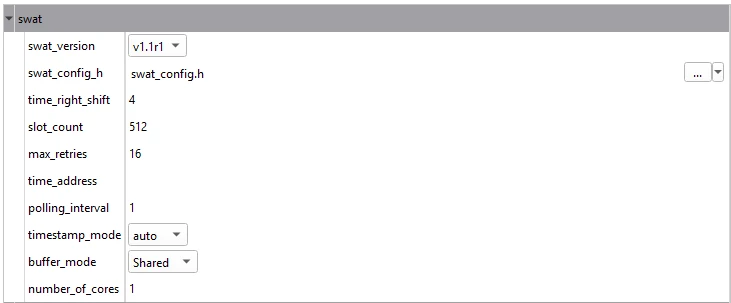
3. On the next page, configure the parameters for swat:
•swat_version - Specifies for which version of SWAT files are generated. This setting should match the version of the used SWAT target code package.
•swat_config_h - Use this attribute to generate the swat_config.h header file directly into the include directory of your application. Do not change the name of the file, only the directory may be adapted.
•time_right_shift - Shift value for timestamp reduction. Controls how many bits to shift right when encoding timestamps, affecting precision vs range.
A higher number provides better range, a lower one better precision.
Note: this field is unused when timestamp_mode is 32-bit.
•slot_count - Number of 32-bit slots in the SWAT ring buffer. Must be less than 0x8000 (32768).
•max_retries - Maximum number of retries for compare-and-swap operations before marking a failure. Controls how persistent the buffer is when under contention.
•time_address - Configure for synchronized tracing, i.e. tracing of SWAT in combination with other trace sources such as mDIO or hardware trace on a second ECU. It should match the memory mapped counter address used by the SWAT_STORE_TIMESTAMP macro.
•polling_interval - Period in milliseconds for how often the SWAT streamer polls the target. Defaults to 1. Set to 0 for maximum sampling rate.
•timestamp_mode - Configure the number of bits used for timestamping. 16-bit or 32-bit mode are supported. If auto is selected iTCHi sets this option based on the current configuration.
•buffer_mode - Defines if trace buffer is global or split per core. Required version v1.1r1 or later.
•number_of_cores - Only used when buffer_mode is set to PerCore. Set this to number of cores on the target.
 Optional step: Configure on-chip timer

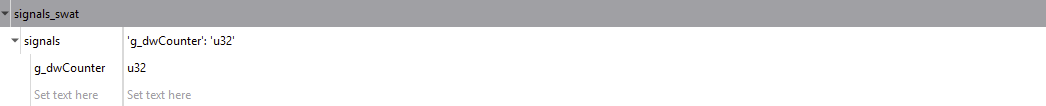
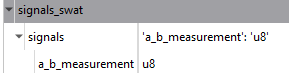
4. Add signal definitions (signals_swat)
For parameter signals add the name of the signals (arbitrary data events) and their type in order to record them. The name is used to display the signal in the timeline.
The supported types are:
•u8
•u32
5. Inspect that paths are matching with those in the workspace.
6. Generate.
Step 2: Add observe points in the code
In the iTCHi generated swat_config.h there are snippets showing you what to add.
Example:
// To profile signal 'g_dwCounter' add the following snippet to your code:
SWAT_observe_u32(g_dwCounter, SWAT_OBSERVER_TYPE_ID_G_DWCOUNTER)
The files with SWAT observe calls should also include swat_observer.h.
Step 3: Allocate the SWAT buffer
SWAT uses one or more global structures to maintain its internal state and to reference the buffer that stores the trace messages. The following integration requirements need to be considered:
•Structure should be allocated in memory that is read- and writable by the application and the debugger.
•Structure must be allocated in uncached memory.
•If MPU is used, it needs to permit access to the structure from all the relevant contexts.
The correct memory for a structure depends on the SoC architecture, and the correct way to allocate it to that memory depends on the build system in use.
The correct approach to allocate the SWAT structure(s) into globally accessible RAM is highly specific to the build environment used by the project.
To achieve this it is often needed to add toolchain specific attributes or pragmas to the variable definitions. This can be done by either:
•Modifying the provided source code
•Defining attribute macros (introduced in v1.1r1)
More information in the link below.
In case of an MPU, all contexts that generate software trace messages by calling the SWAT observer API must have access to the SWAT structure.
For bare metal this means that access from all manually added signal observer calls must be possible.
Step 4: Integrate and rebuild the code
To integrate software tracing into your project, you have to add:
•Generated files
•Files from the target-code directory
In general, you should add these files:
•C source files to one of the source directories of the project
•header files to one of the include directories
•C files might have to be explicitly added to the build (depending on the build environment)
•If using CMake, the provided CMakeLists.txt file can be used to ease integration.
|
Software Tracing relies on architecture specific features for certain functions. Architecture specific code is defined in swat_buffer_arch.h. Take a moment to review the implementation of the macros SWAT_STORE_TIMESTAMP and SWAT_STORE_CORE_ID. In most cases, these macros should work as provided. However, in some scenarios it might be necessary to manually adapt these macros: •SWAT_STORE_TIMESTAMP is used for adding timestamps to the trace messages. Make sure that the used counter register is enabled by your application and not utilized in a different way. If necessary, adapt the counter address accordingly. •SWAT_STORE_CORE_ID is used for adding the core ID to Runnable and signal messages. In some cases, physical core IDs and logical core IDs (used by the OS) might not match. In such cases, you might have to update this macro to account for such scenarios. |
|
Each swat_buffer_arch.h file contains implementation for one device family. In some cases, a presence of macro SWAT_SOC_<device_name> is checked to handle the differences between devices of this family.
Currently, this macro is needed for the following devices. For others, there’s no need to define it. •All RH850 devices •S32K38x lock-step devices (core 0 and core 1 in lock-step)
Review swat_buffer_arch.h file and define the appropriate macro for your device (if needed). This can be done with the compiler command line option or by adding preprocessor define in swat_config.h. |
1. Add the following files to your software build:
a.Static files from the target-code directory:
oswat_buffer.c
oswat_buffer.h
oswat_observer.c
oswat_observer.h
b.Generated file:
oswat_config.h
c.Device-specific file:
oarch/<used_device_family>/swat_buffer_arch.h
2. Rebuild your application.
3. Verify:
a.Download and run the application.
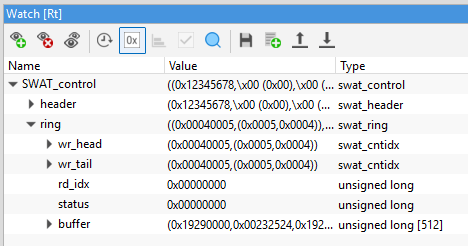
b.Open the main SWAT structure in the Watch window.
c.Confirm that data is being added to the buffer.
d.Confirm that member header has been initialized.
After you run the application, data should be added to the buffer and the index variables should change.
Step 5: Configure winIDEA Analyzer
To correctly display data in the winIDEA we have to ensure the following settings:
1. Configure AUTOSAR in Debug | Configure Session... | Applications | Edit.
a.Set winIDEA Os Info XML as RTOS description file type
b.Set Profiler.xml that was generated by iTCHi as RTOS description file location
2. Go to Hardware | CPU Options | Analyzer and configure:
•For Arm-based SoCs:
i.Set Operation mode to SoC.
ii.Go to Hardware | CPU Options | SoC and set Trace Capture method to None.
•For all other architectures set Operation mode to None.
3. Set the correct cycle duration of the timer used by SWAT. The used timer depends on the device, as described in optional step: Configure on-chip timer.
|
Without a correctly configured Cycle duration, timestamp values reported by the Analyzer will be incorrect. The error Period between two events is too long might also be incorrectly detected. |
4. In Tools | License ensure that SWAT Add-on is enabled and that a valid license is configured.
5. Perform a Download or Load Symbols to apply the changes.
6. Select the OS objects to trace.
7. Start a new trace recording.
You can trace from Reset by starting the recording first and then the target, or you can also start recording when the application is already running.
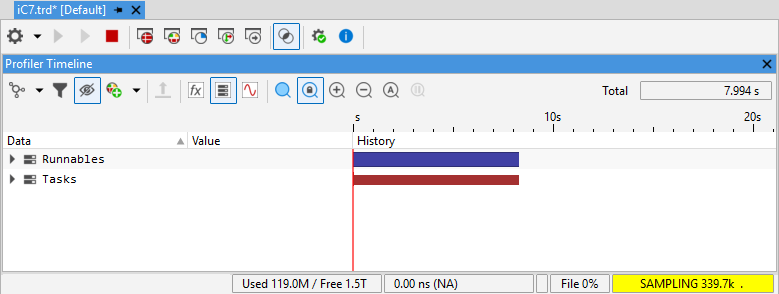
If everything is set up correctly:
•The status field should display SAMPLING with an increasing number indicating how much data has been recorded.
•After a few seconds, the Profiler Timeline should start to populate with Thread and Runnable data.
Synchronized trace
SWAT has the ability to record synchronized traces with multiple trace sources. For example, it is possible to record via SWAT (for one ECU), hardware tracing (for a second ECU), and mDIO (for I/O pin states) into a single, synchronized trace, which means all events share a common time base.
To configure Synchronized Tracing, follow these steps:
1. Specify the memory mapped address of the counter used in swat_buffer_arch.h.
This is done via the time_address attribute in iTCHi, swat section. For example, for Infineon AURIX, STM0.TIM0 is used, which has the address 0xF0001010.

2. Go to Analyzer | Analyzer Configuration | Recorder and enable option Generate time synchronization messages.
Synchronized tracing of SWAT in combination with other trace sources is now possible. Refer to Sync Trace for more information.
Recording between arbitrary points
A common use case is to measure the time between two arbitrary points in the code. These two points could be located inside the same function (to measure the execution time of a specific code block) or in totally different modules (to measure the propagation delay of a value from one point to another).
SWAT supports measurement of such scenarios via signals.
This is achieved using the general purpose SWAT signals.
1. Follow the bare metal setup.
2. In iTCHi, add a signal for this purpose. The new signal does not actually have to exist in the code. For example, it could just be called a_b_measurement.
3. Select Generate.
4. Generate profiler.xml and code.
Integrate it into the project following the regular guide. Reference the bottom of swat_config.h to verify that the configuration for the signal has been created:
#define SWAT_OBSERVER_TYPE_ID_A_B_MEASUREMENT 1UL
// To profile signal 'a_b_measurement' add the following snippet to your code:
// SWAT_observe_u8(a_b_measurement, SWAT_OBSERVER_TYPE_ID_A_B_MEASUREMENT);
You are now ready to integrate the observer call into your code. Let’s say you want to measure the time of a specific code block in the function example_function_timing.
Make the observer API visible by including swat_observer.h. You can then create signal events as shown below. The first argument to the SWAT_observe function is the value that the signal should take, and the second argument is the ID of the signal.
// Other includes
#include "swat_observer.h"
void example_function_timing(void)
{
// Mark the start of the code block of interest with '1'
SWAT_observe_u8(1, SWAT_OBSERVER_TYPE_ID_A_B_MEASUREMENT);
for (volatile int i = 0; i < 1000000; i++); // Do some work
// Mark the end of the measurement with '0'
SWAT_observe_u8(0, SWAT_OBSERVER_TYPE_ID_A_B_MEASUREMENT);
}
You can then select the Profiler object for the a_b_measurement signal in the winIDEA Analyzer. If the code has been integrated correctly, and the function is executed, you can see in the timeline that a_b_measurement changes to 1 whenever the code block starts to be executed and back to 0 after it has finished execution.
More resources