Task State and ISR Profiling via Instrumentation
In this topic:
•Enable ORTI and OS Timing Hooks in DaVinci Configurator
•Instrument and Generate XML using iTCHi
Introduction
Task state and ISR profiling via instrumentation utilizes the Vector OS Timing Hooks to instrument task states and ISR executions. This approach provides detailed insights into the system’s behavior by capturing task state transitions and ISR events. This method involves the following steps:
|
Enabling in DaVinci Configurator: |

a.ORTI file generation
b.OS Timing Hooks generation
|
Configuring iTCHi to generate instrumentation code and XML file. |

The Trace Configuration Helper iTCHi is a program that helps users configure the winIDEA Analyzer to record OS and RTE aware hardware traces. Refer to Trace Configuration Helper to learn how to run and configure it.
|
Recompiling the application with the generated instrumentation code. |

|
Configuring winIDEA to analyze the trace data using the generated XML file and to record the instrumentation variables. |

|
Record a trace. |


Vector Task State Instrumentation Workflow
Enable ORTI and OS Timing Hooks in DaVinci Configurator
For OS Task and ISR profiling via instrumentation, you need to enable ORTI file generation and the OS Timing Hooks in your Vector MICROSAR project. Follow these steps:
|
In DaVinci Configurator, open the Basic Editor. |
|
In the Basic Editor, expand the OS node. |
|
Navigate to the OsOS node and select the OsDebug node. |
|
Activate ORTI Debug Support by selecting ORTI_23_STANDARD or ORTI_23_ADDITIONAL. |
|
In the OsDebug view, locate the Timing Hooks Include Header setting. |
|
Add a new header by clicking the plus symbol and name it Os_TimingHooks_winidea.h. |

|
Regenerate the OS. |

This process generates the OS ORTI file. After generating the OS, you should find a file Os_Trace.ORT in your Appl/GenData directory. It also enables the OS Timing Hooks, which can now be implemented in the specified header file.

Instrument and Generate XML using iTCHi
To implement the OS hooks and generate the respective Profiler XML, follow these steps:
|
In the iTCHi wizard, make sure your itchi.json file is selected or create a new one if necessary. |
|
Ensure your ORTI file and Profiler XML file are specified correctly. |
|
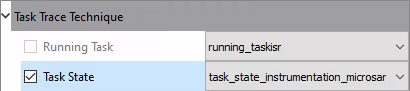
Select the Task State analysis technique. |
|
Choose task_state_instrumentation_microsar as the command and press Next. |
|
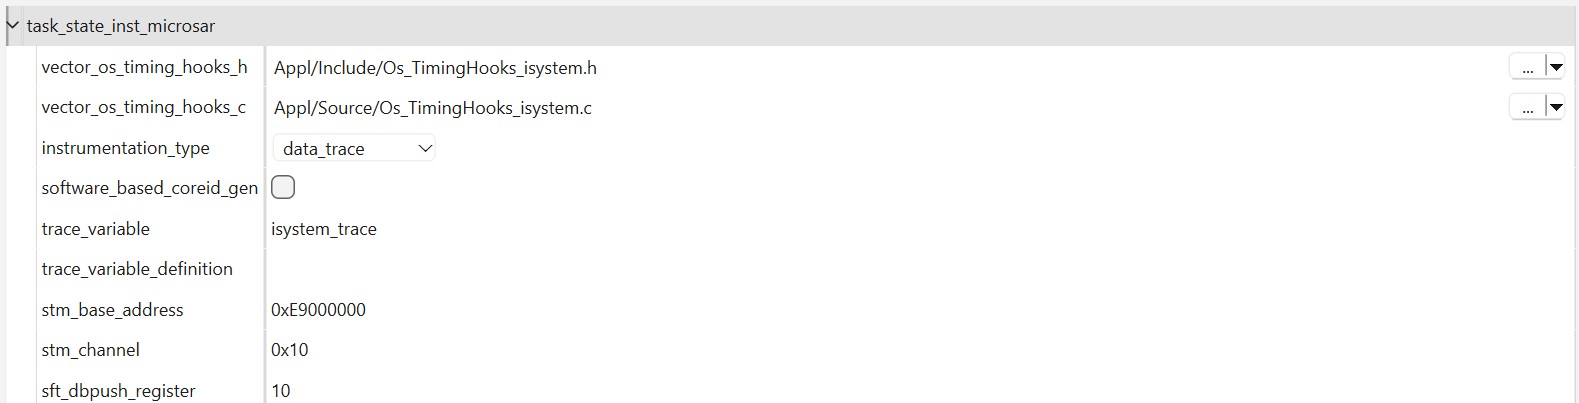
Under task_state_inst_microsar, configure the OS instrumentation header and source file. |
a.Point vector_os_timing_hooks_h to the Appl/Include directory of your project.
b.Point vector_os_timing_hooks_c to the Appl/Source directory of your project.
c.Leave the filenames as they are, so the string for the header file would be:
<your_davinci_dir>/Appl/Include/Os_TimingHooks_winidea.h |
|
Depending on your microcontroller, pick the right instrumentation_type. |
Refer to section Trace Configuration for more information.
•In most cases, data_trace is the best approach.
•For RH850 controllers without data trace capabilities, select software_trace.
oIn this case, also change the sft_dbpush_register to 10.
•For devices that have STM, select stm_trace.
oIn this case, also configure stm_base_address and stm_channel.
oNote that the STM base address is device-specific.
|
Unselect software_based_coreid_gen. |
This allows the winIDEA analyzer to get the core ID from the trace and usually works best.
|
Click Generate to create the instrumentation and XML file. |

The process has generated the Os_TimingHooks_winidea.c and Os_TimingHooks_winidea.h source files, as well as the Profiler XML file. These files are now ready to be integrated into your project.
Rebuild the application
After generating the Profiler XML and instrumentation code, it’s necessary to add the C and H files to the build process of your Vector MICROSAR application.
|
Copy the generated files to Appl\Source and Appl\Include directory in your project. |
(If you did not generate them to those locations already.)
•Os_TimingHooks_winidea.c
•Os_TimingHooks_winidea.h
|
Adding Os_TimingHooks_winidea.c is only required for data_trace as it contains the definition of the trace variable. |
When using an Infineon AURIX with multiple cores, edit Os_TimingHooks_winidea.h to map the trace variable into global LMU RAM. There is a comment in the source file that explains how to do that.
|
Add Os_TimingHooks_winidea.c to one of the makefiles. |
Include the following line in the appropriate section of the makefile:
a.APP_SOURCE_LST += Source\Os_TimingHooks_winidea.c
b.Again, this is only required for data_trace.
|
Build your application. |
Open a command prompt in the build directory, and execute the following command: .\m.bat
Once the build has finished, download the instrumented application via winIDEA. For data tracing, add the winidea_trace variable to a Watch Window and confirm that it changes when you enable real-time updates. For instrumentation tracing, this step does not apply.
Configure winIDEA
The generated Profiler XML file shall be used from winIDEA. To profile the Task State and ISR, a winIDEA Analyzer configuration is required. Please follow these steps to configure winIDEA accordingly:
|
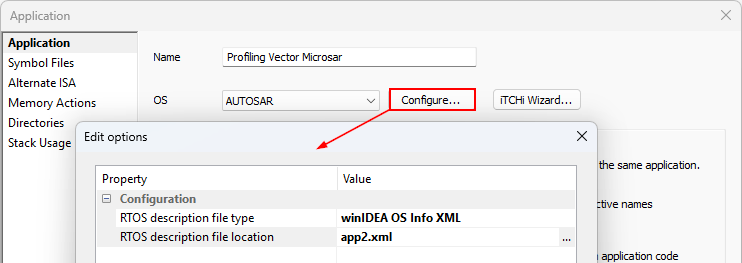
In winIDEA, navigate to Debug | Configure Session | Applications. |
|
Configure AUTOSAR. |
Select winIDEA OS Info XML as RTOS description file type and select the previously generated Profiler XML file in the RTOS description file location.
|
Perform a Download or Load Symbols action to apply the changes. |
|
Create a Analyzer configuration via View | Analyzer | Create New Configuration. |
|
Select the Automatic Hardware Trigger to configure the hardware trace unit automatically. |
Alternatively, you can configure the hardware trace unit manually when you select the Manual Hardware Trigger. Configure data trace comparators for all variables which must be traced (in this use case the variables used for the ORTI attributes RUNNINGTASK / RUNNINGISR2 / STATE).
iTCHi can log all variables that have to be traced by using the iTCHi command line argument --log_trace_symbols.
The trace configuration highly depends on the used microcontroller or SoC. Please check Trace Configuration for more details.
|
Open the created Analyzer configuration and add the Application / Process. |
The application / process has to include all cores that you want to profile.
|
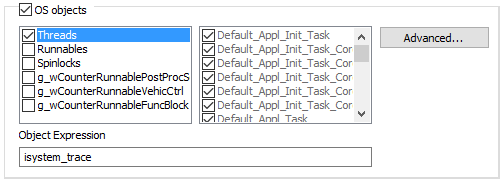
Enable OS Objects and Threads under OS Objects in the Profiler entry from the application / process |
|
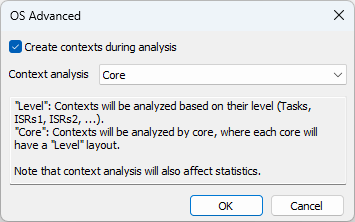
(recommended) For multi-core systems, change the Context analysis to Core via the Advanced button. |
Start profiling
After configuring winIDEA, you can now use the winIDEA Analyzer and start the Analyzer session to record and profile the instrumentation data.

|
If you don’t see any data or the data does not look plausible, please check the Knowledge Base. |