Non-Instrumented Task State and ISR Profiling
In this topic:
•Enable ORTI in DaVinci Configurator
•Use iTCHi to generate the XML
Introduction
This section explains how to profile Task states and running ISR information utilizing data tracing without instrumentation (meaning no changes to the source code are necessary).
To facilitate this use case, the ORTI file provides a STATE attribute for each task. By evaluating the state expression, the state of the task at a given moment can be deduced. The challenge with Vector MICROSAR state tracing is that the state attribute consists of multiple variables as shown in the following listing.
TASK Default_Appl_Init_Task { |
|
Multiple variables in the ORTI STATE expression might cause issues in the data tracing •If the number of variables which must be traced is greater than the number of available data trace comparators on the HW, the HW can’t trace all of the variables simultaneously and winIDEA won’t be able to reconstruct the state of the task •If variables aren’t updated during the trace recording (i.e., the OS doesn’t write a new value into these variables), winIDEA won’t be able to reconstruct the state of the task oFor example, the OsState variable in the listing above is only written once at the startup of the application. To be able to start a recording at a different point in time, this variable has to be set to 2. oSimilarly, for a background task, the State variable always has the value 1 for READY.
To overcome these issues, iTCHi allows defining constant variables. Please check the configuring iTCHi step for more details. |

The following configuration steps are required for state analysis without instrumentation:
|
Enabling ORTI file generation in DaVinci Configurator. |

|
Configuring iTCHi to generate the XML file. |

The Trace Configuration Helper iTCHi is a program that helps users configure the winIDEA Analyzer to record OS and RTE aware hardware traces. Refer to Trace Configuration Helper to learn how to run and configure it.
|
Configuring winIDEA to analyze the trace data using the generated XML file and to record all required variables. |

|
Record a trace. |

Enable ORTI in DaVinci Configurator
|
In DaVinci Configurator, open the Basic Editor. |
|
In the Basic Editor, expand the OS node. |
|
Navigate to the OsOS node and select the OsDebug node. |
|
Activate ORTI Debug Support by selecting ORTI_23_STANDARD or ORTI_23_ADDITIONAL. |
|
Regenerate the OS. |

This process enables the OS ORTI file generation. After generating the OS, you should find a file Os_Trace.ORT in your Appl/GenData directory.

Use iTCHi to generate the XML
To generate a winIDEA OS Info XML for task state and ISR analysis without instrumentation, follow these steps:
|
In the iTCHi wizard, make sure your itchi.json file is selected. |
|
Ensure your ORTI file and Profiler XML file are specified correctly. |
|
Select the Task State analysis technique. |
|
Choose task_state_complex_native as the command and press Next. |
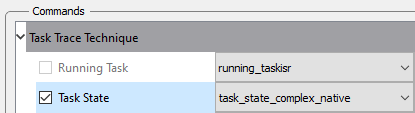
You can leave the running_taskisr settings as they are.
|
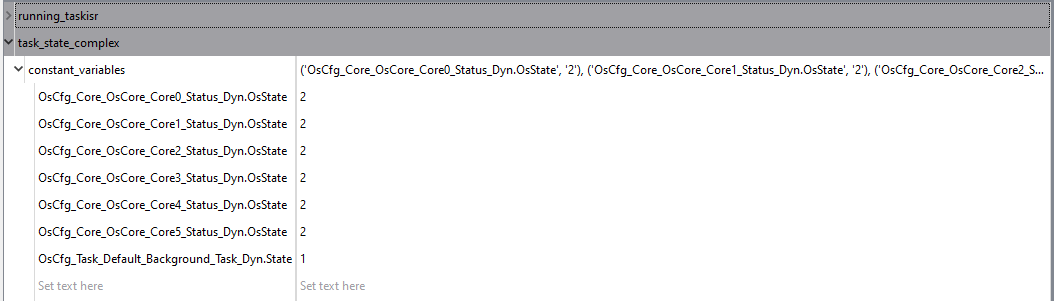
Under task_state_complex, use constant_variables to set all non-changing variables to their expected constant value. |
•For Vector MICROSAR, set OsState variables to 2. The screenshot below shows how this would look like for an application that uses six cores. Also set task State variables to 1 (meaning READY) for tasks that might not otherwise change their state. This might be required for background tasks.
•If you start recording before the startup of the application, you don’t have to do this.
|
The constant variables are handled statically. The constant variables won’t be considered anymore in the trace recording. If an assigned default value is incorrect or the variable value is changing over time, the results shown in the Analyzer might be inaccurate. |
|
Click Generate to create the XML. |

Configure winIDEA
The generated Profiler XML file shall be used from winIDEA. To profile the Task State and ISR, a winIDEA Analyzer configuration is required. Please follow these steps to configure winIDEA accordingly:
|
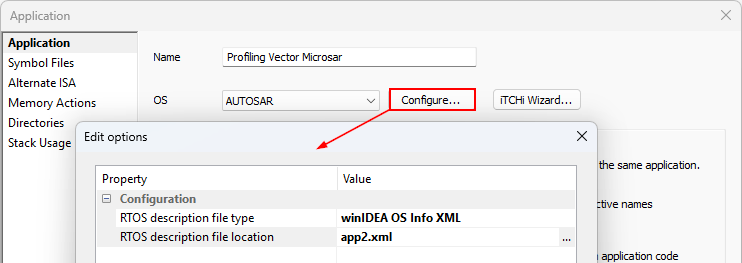
In winIDEA, navigate to Debug | Configure Session | Applications. |
|
Configure AUTOSAR. |
Select winIDEA OS Info XML as RTOS description file type and select the previously generated Profiler XML file in the RTOS description file location.
|
Perform a Download or Load Symbols action to apply the changes. |
|
Create a Analyzer configuration via View | Analyzer | Create New Configuration. |
|
Select the Automatic Hardware Trigger to configure the hardware trace unit automatically. |
Alternatively, you can configure the hardware trace unit manually when you select the Manual Hardware Trigger. Configure data trace comparators for all variables which must be traced (in this use case the variables used for the ORTI attributes RUNNINGTASK / RUNNINGISR2 / STATE).
iTCHi can log all variables that have to be traced by using the iTCHi command line argument --log_trace_symbols.
The trace configuration highly depends on the used microcontroller or SoC. Please check Trace Configuration for more details.
|
Open the created Analyzer configuration and add the Application / Process. |
The application / process has to include all cores that you want to profile.
|
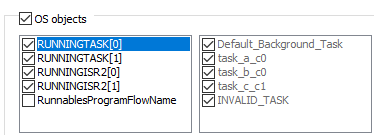
Enable OS Objects and Threads under OS Objects in the Profiler entry from the application / process |

Start profiling
After configuring winIDEA, you can now use the winIDEA Analyzer and start the Analyzer session to record and profile the instrumentation data.

|
If you don’t see any data or the data does not look plausible, please check the Knowledge Base. |