Please enable JavaScript to view this site.

winIDEA Help

Version: 9.21.241

Configuration

This chapter described the configuration steps for AUTOSAR Operating System.


number1

Select AUTOSAR via Debug / Configure Session / Application / Edit and press the Configure.


Autosar-os-config


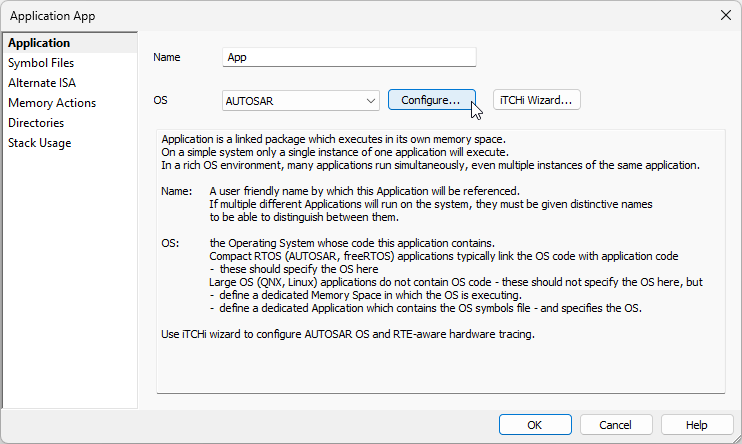
You can follow Session Configuration Wizard as well.


number2

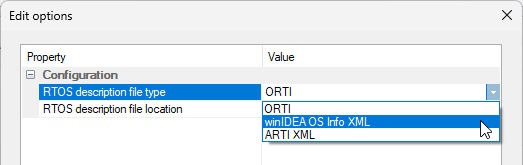
Specify description file type and location.

RTOS-Autosar-Options


i-icon

This file will be used as a source of information for OS debug views, as well as OS profiling. winIDEA supports two file formats:

ORTI - Provides basic description on OS variables and OS profiling; generated by the OSEK builder.

winIDEA OS Info XML - Includes a reference to the ORTI file, as well as provide additional configuration options. Use Trace Configuration Helper to create an AUTOSAR trace configuration file.


Warning_orange

In some cases the generated ORTI file contains information that is not directly usable - in these cases you will need to either manually edit the ORTI file or override parts of the configuration through the XML file. Contact Technical support if you need help with the ORTI modifications.


number3

Perform Debug / Download.


Selecting desired OS signalization method

Symbols specified as RUNNINGTASK, RUNNINGISR2 are used to show the OS state during debug when the CPU is stopped.

OS Profiling, however, can be implemented in two different ways. Either through:

data trace (if supported by the MCU) or

instrumentation trace (OTM, ITM, SofTrace, User Trace Port...)


By default data trace is used for OS Profiling, the only prerequisite is to have RUNNINGTASK, RUNNINGISR2... specified as simple variables (not pointers to these variables).

If your ORTI file uses vs_SIGNAL specifications, these specify the instrumentation trace method that will be used for trace (instead of data trace). In such cases you need to make sure that the application is correctly instrumented.


CURRENTTASK and CURRENTISR are given as pointers

All OSEK implementations include structures that describe the current state of the OS (current task, current ISR...). This structure is placed in a fixed memory location and it's address needs to be known in advance in order to trace it.

ORTI generators often specify a pointer to this structure, which can easily be followed by OS awareness plugins, but unfortunately can not be directly traced.


An example of such ORTI configuration would be:

RUNNINGTASK[1] = "OS_kernel_ptr[1]->taskCurrent";
RUNNINGTASK[2] = "OS_kernel_ptr[2]->taskCurrent";
RUNNINGISR2[1] = "OS_kernel_ptr[1]->isrCurrent";
RUNNINGISR2[2] = "OS_kernel_ptr[2]->isrCurrent";


In this case the RUNNINGTASK / RUNNINGISR are given as pointers, which can not be resolved by the trace engine and therefore can not be used for OS signaling.

To circumvent this limitation, you need to find the symbol (or memory location) that this pointer points to.


Based on the example above, the easiest way to find this memory location is to:


rtos-Autosar-KernelDataStruct

1.Start the application.

2.Run until the point where the OS is initialized.

3.Pay attention to the address the RUNNINGTASK / RUNNINGISR pointer points to by inspecting the correlating variable in the watch window (e.g. OS_kernel_ptr[1]->taskCurrent).
In our case this was 0x51800840.

4.Open the View menu / Debug / Symbols view / Variables.

5.Sort the variables by address.

6.Search for the symbol (structure) that is the closest match to the address you found:

RTOS-Autosar-KernelDataStructMember

7. Expand the structure with a double-click and look for the element with the address you found earlier.

8. Use this variable to replace the pointer which was initially specified as RUNNINGTASK / RUNNINGISR.

9. Save the changes to the ORTI file.


Copyright © 2024 TASKING Germany GmbH