Deos
On this page:
Introduction
winIDEA provides dedicated debug support for the Deos RTOS. This includes specialized views for kernel objects, such as processes, threads, semaphores and mutexes.
Additionally, views such as Process History and Scheduler History are available.
Requirements
•Deos kernel symbols
•winIDEA version 9.21.410 or newer
Setup
Step 1: Create memory space associated with the kernel
1. Select Debug > Configure Session... > SoCs > Edit > Memory Spaces.
2. Select Add and define the options.
Step 2. Create a kernel application
1. Open Debug > Configure Session … > Applications > Edit.
2. Select Deos under OS.
3. Select Configure and set up the path to the names.dat file.
By default the one in workspace root is used.
Step 3: Provide the path to libkernel.so.dbg file
1. Go to page Symbol Files and select the libkernel.so.dbg file.
2. Select Edit and provide the correct path.
3. Select Advanced and check Merge Types.
4. To view the objects described below, stop the SoC and observe.
Process
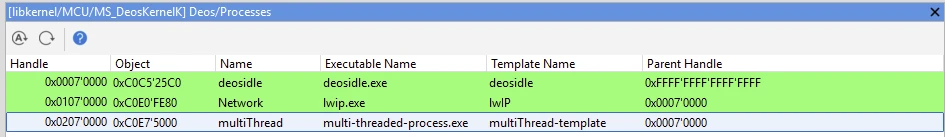
The Process window shows information about all running processes. To open it go to View > kernel application > Process.
With a double-click on a process in this view, we directly control which process is observed in views which display process related objects.
Column explanation
The following table describes each column in the Process window:
Column |
Description |
|---|---|
Handle |
Numeric ID assigned to the process |
Object |
Address of the process object in the kernel |
Name |
Name of the process, if name is present in the names.dat file, otherwise name hash is displayed. |
Executable Name |
Name of the executable |
Template Name |
Name of the template used to create this process. |
Parent Handle |
Handle Id of the parent process |
If a process has threads that are currently executing, the whole process is colored green (see deosidle and Network above)
Thread
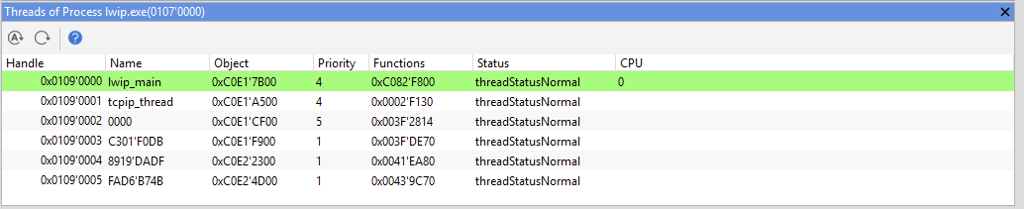
To view threads, open View > kernel application > Threads.
In the Process View double click on the process of which threads should be displayed.
Column explanation
The following table describes each column in the Thread window:
Column |
Description |
|---|---|
Handle |
Numeric ID assigned to the thread |
Name |
Name of the thread, if thread name is specified in the names.dat, hash name is displayed otherwise. |
Object |
Address of the thread object |
Priority |
Priority of the thread, see threadTemplate period in DEOS documentation. |
Functions |
Address of the threads entry function |
Status |
status of the thread can be one of values: •threadStatusNotCreated •threadStatusNormal •threadStatusRestarting •threadStatusStopping |
CPU |
CPU index on which this thread is currently executing. If left blank, it is currently not executing. |
Similarly to Process view, current executing thread is colored in green.
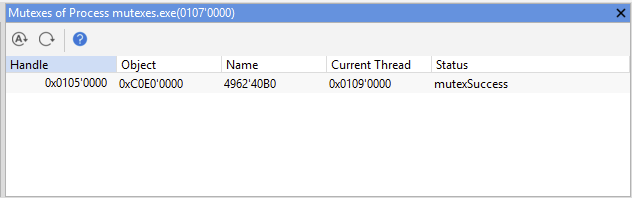
To view mutexes, open View > kernel application > Mutex.
In the Process View double click on the process of which mutexes should be displayed.
Column explanation
The following table describes each column in the Mutex window:
Column |
Description |
|---|---|
Handle |
Object handle |
Object |
Mutex address |
Name |
Mutex name, if name is specified in the names.dat, hash name is displayed otherwise. |
Current Thread |
Thread handle that has acquired the mutex |
Status |
Status |
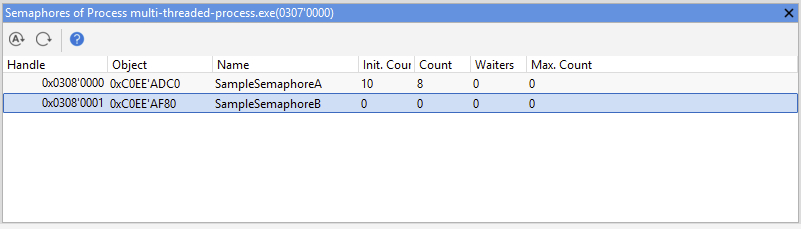
To view semaphores, open View > kernel application > Semaphores and in the Process View double click on the process of which semaphores should be displayed.
Column explanation
The following table describes each column in the Semaphore window:
Column |
Description |
|---|---|
Handle |
Object handle |
Object |
Semaphore address |
Name |
Name of the semaphore or hash, if name is not provided in names.dat |
Init. Count |
Initial count at the time of semaphore creation |
Count |
Current count of the semaphores |
Waiters |
Number of waiting threads |
Max. Count |
Process History window
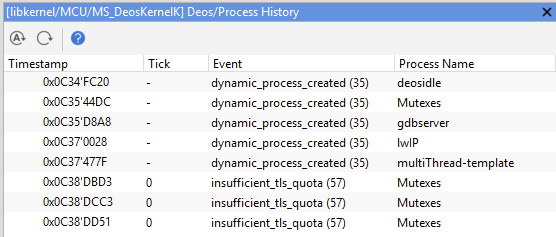
To view process history, open View > kernel application > Process History. In this view events such as process creation are logged.
Note that only limited amount of logs are kept, and when the kernel buffer is full, old entries are rolled over.
Column explanation
The following table describes each column in the Process History window:
Column |
Description |
|---|---|
Timestamp |
Timestamp at which the event occurred |
Tick |
The corresponding tick of event |
Event |
String description of event ID |
Process name |
Name of the process that event is related to (or hash if process name is not present in the names.dat). |
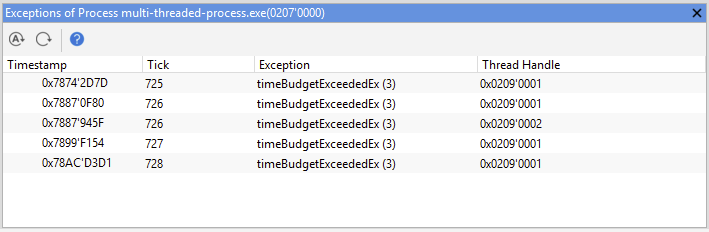
Process Exception window
To view semaphores, open View > kernel application > Process Exception and in the Process View double click on the process of which exceptions should be displayed.
Note that only limited amount of exception is kept, and when the processes exception buffer is full, old exceptions are rolled over.
Column explanation
The following table describes each column in the Exception window:
Column |
Description |
|---|---|
Timestamp |
Timestamp in which the exception occurred |
Tick |
The tick in which exception occurred |
Exception |
Name(ID) of exception that was thrown |
Thread Handle |
Thread in which exception occurred |
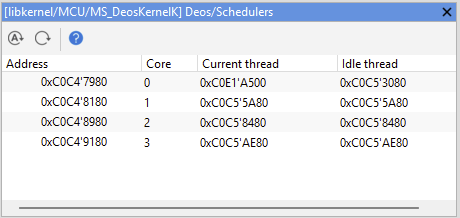
To view process history, open View > kernel application > Schedulers. This view lists currently running schedulers.
Column explanation
The following table describes each column in the Scheduler window:
Columns |
Description |
|---|---|
Address |
Address of the scheduler |
Core |
Core on which the scheduler is running on |
Current thread |
Address of a thread which is currently executing |
Idle thread |
Address of schedulers idle thread. |
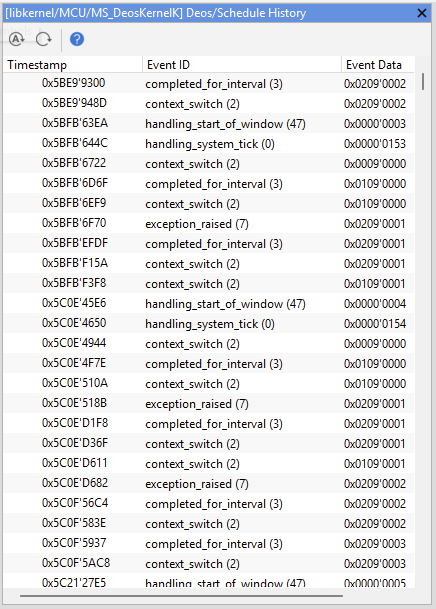
Scheduling History window
To view process history, open View > kernel application > Schedule History. In this view events related to scheduling, such are context switching, windows, ticks, etc., are displayed.
Note that only limited amount of events is kept, and when the kernel buffer is full, old events are overwritten.
Column explanation
The following table describes each column in the Scheduling History window:
Column |
Description |
|---|---|
Timestamp |
Timestamp of the scheduling event |
Event ID |
Name(ID) of scheduling event |
Event data |
Data that is related to the event. The meaning of the data changes from event to event. |