Examples
In this topic:
•Cumulative debug clock cycle counter
Introduction
1. Make sure to apply the counter settings after the CPU reset (or configure this in the plugin options).
2. Reset the flags and counters before you begin with measurements.
3. Configure the plugin to provide the following measurements:
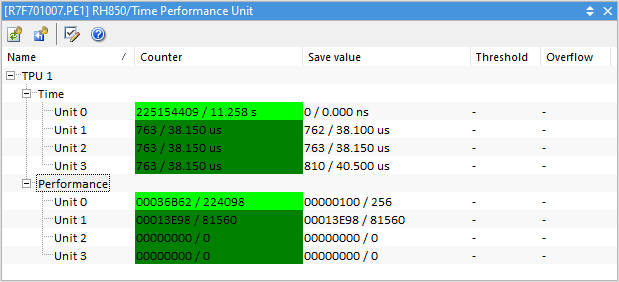
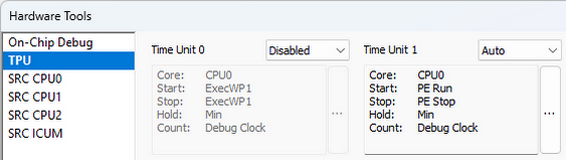
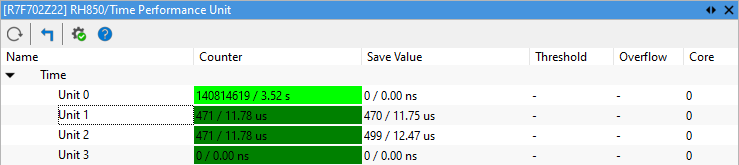
Time unit 0
This unit is unused by the plugin and is left at its default cycle counter operation. It counts debug clock cycles between CPU start and stop. Considering we are using the LPD port with the debug clock frequency of 20MHz, one debug clock cycle lasts for 50ns. To get total execution time between start and stop, multiply the decimal counter value with 50ns debug clock period to obtain timing measurement. The calculation is done by the plugin as a convenience and the example displays a run-time of 11.258 seconds.
Time units 1, 2 and 3
The units are configured to profile a function and they count debug clock cycles between the entry into dummyFunction and its exit, Execution Watchpoints 1 and 2, respectively. The units 1..3 store the minimum count, the last count, and the maximum count, respectively, into the Save value register. As shown, during the 11.258s overall execution time the minimum execution time of the function was 38.1 us and the maximum execution time was 40.5us.
A possible extension to this setup would be to specify a maximum allowable function execution time to, say, 40.8us, in order to catch a function anomaly. 40.8 us divided by 50ns debug clock period is 816, and in hex this is 330 - a value for the Threshold setting in the Time unit 2. Set also break CPU on Threshold violation to stop the CPU for analysis.
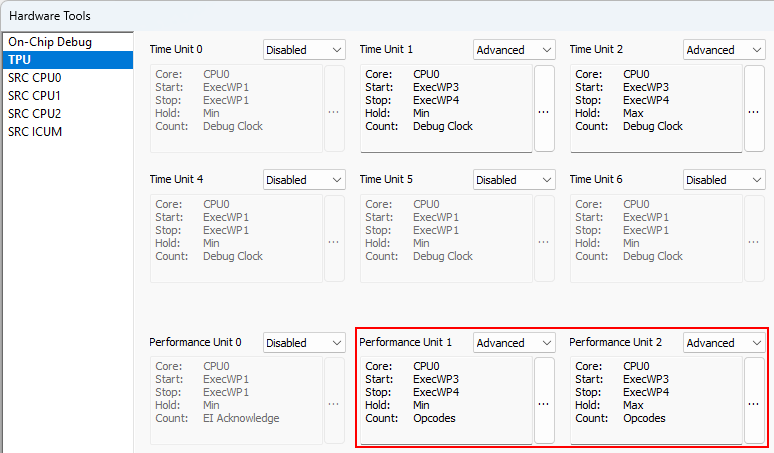
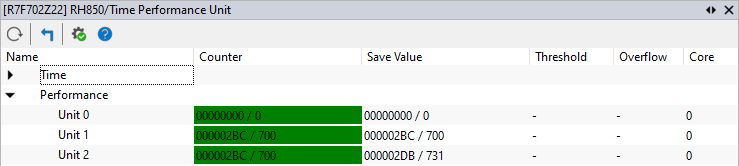
Performance unit 0
Counts the number of acknowledged EI level interrupts across the complete run-time of the CPU.
Performance unit 1
Counts the number of acknowledged EI level interrupts between the selected function entry and its exit. It is interesting to note that the count ratio between the units uncover how much time the CPU spent in the function. Assuming that the interrupts are periodic, of course. The count ratio 81560/224098 is 36%. Given 11.258s run-time, the time spent in the function is about 4.1 seconds.
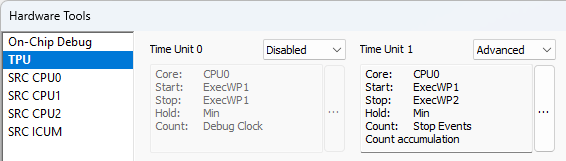
Cumulative debug clock cycle counter
The counter does not automatically reset between CPU stop and restart operations; it continues to accumulate values.
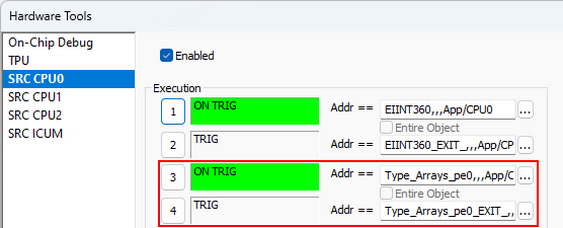
Count interrupt handler hits
This does not merely count ExecWP2 events; instead, it counts the number of completed measurements.
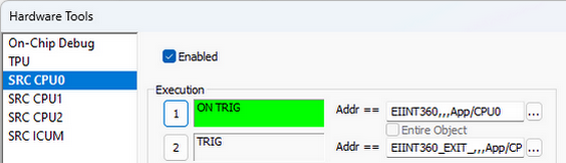
You can also use a Performance Unit for any interrupt:
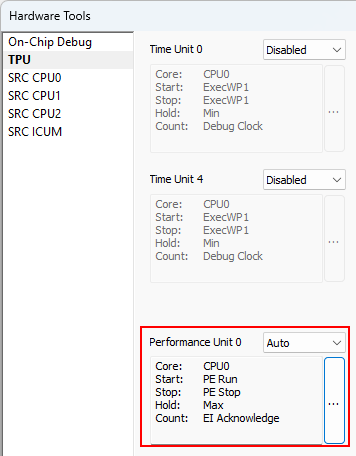
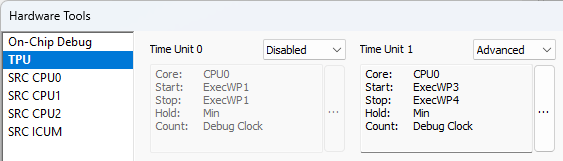
Time interrupt handler hits
Measure time spent in an interrupt handler, or a very short function, using Debug clock time base.
By dividing the time spent with the count of interrupt hits, an average execution time of the handler can be calculated.
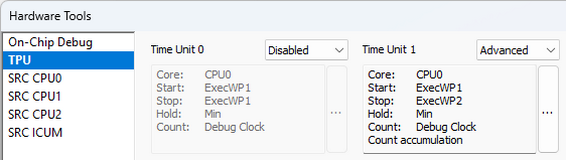
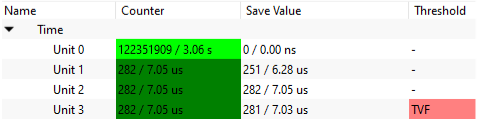
Time a function
Measure Min and Max of a function using Debug clock time base
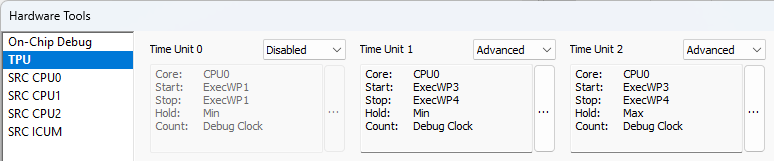
The following image shows:
•Unit 0: CPU run time
•Unit 1: Last execution, Min execution time
•Unit 2: Last execution, Max execution time
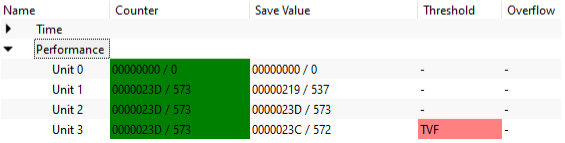
Measure Min and Max of a function by counting opcodes
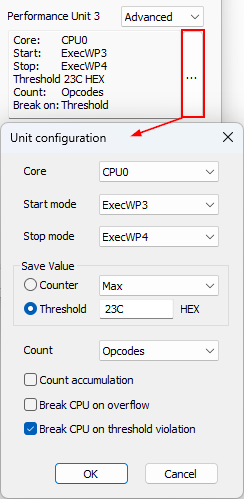
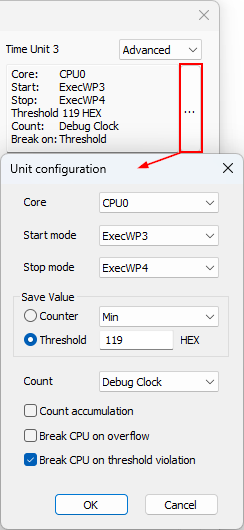
Break on Threshold
To break execution if the function exceeds a maximum execution time, either Time or Performance units can be used. Select Counter Max, and define the Threshold value in HEX.
Using Time Unit
The example 0x119 below corresponds to 281 decimal. The Save Value register holds the Threshold value.
Conversely, to break if the function ends prematurely, select Counter Min, and define the lower Threshold value in HEX.
Using Performance Unit