Advanced TPU configuration
Up to and including Renesas TMU V4.1 specification, each core features it's own TPU. That's in RH850G3 and RH850/U2A devices. The plugin options display a pair of configuration tabs (TPU, SRC) for each core. Together they provide a fine control over the available TPUs.
In Renesas TMU V4.2 specification the cores share the common Time and Performance Unit counters. So there's a single TPU tab and units with Core selection. See also the Examples page for illustration.
Start/stop condition
To enable the unit you need to select the Auto or Advanced mode via Hardware | SoC Debug Module.
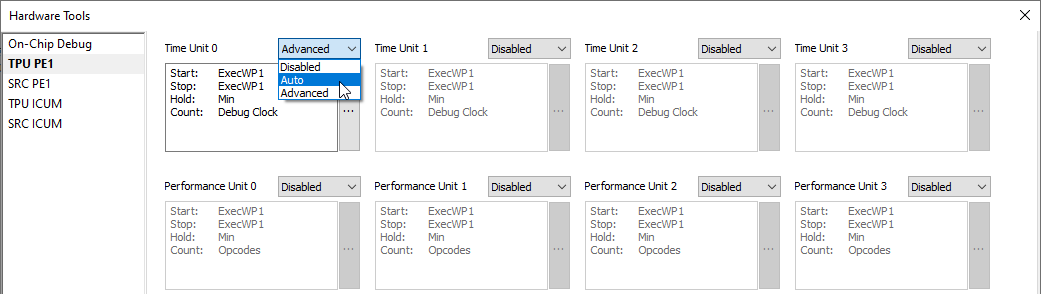
Auto - Configure the start and stop condition to the start and stop of the CPU, which is sufficient in most cases.
Advanced - Configure the start and stop condition to different kinds of events generated by the CPU's on-chip debug logic (execution watch points, data access watch points, sequencer events). If used, these events must be configured manually through the SRC tab.
Unit configuration
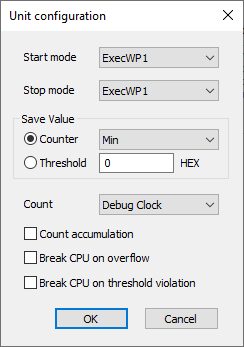
To configure the unit, click the ''...'' button inside the unit settings.
Core - Associated core with the SoC TPU plugin. The setting is not present in the core TPU plugin where the core is defined implicitly.
Start/stop mode - Available if the Advanced mode is selected. Make sure to configure the events in the SRC page once you select the desired events.
Save value - Configure to either:
•Counter - Save the counter value at it's maximum, minimal or last value between multiple start / stop events or
•Threshold - Store the threshold value. In this case select whether the threshold limit represents the maximal or minimal acceptable value.
Count - Specify the events you wish to count:
Debug clock - Counts debug clock ticks which can be used for measuring time. Note that the Debug clock depends on the settings in winIDEA. Refer to the Debug clock chapter for more information.
Stop Events - Used for counting events. Refer to the SoC events chapter for more information.
Count accumulation - Note that it is possible to either start counting from 0 each time the start condition is fulfilled, or the counter can accumulate the values over the sessions.
Break CPU on overflow - The CPU will break when the counter overflows. Use this to eliminate false measurements. More information below.
Break CPU on threshold violation - The CPU will break when the threshold violation occurs. Counter values are compared to the threshold limit after each measurement ends (when the stop condition is fulfilled). More information below.
Debug clock
|
Debug clock depends on the settings in winIDEA. |

Using the LPD debug port, then the debug clock is the same as it is specified in the Hardware | CPU Options | SoC | LPD clock setting. The higher the LPD clock, the more accurate the measurement will be. Note, however, that the LPD clock can not be set to an arbitrary value. If the LPD clock frequency exceeds CPU specifications the debug connection to the CPU may become unreliable.
|
Debug clock might not be exactly the same as specified, because the CPU limits available debug clock frequencies. To get accurate debug clock frequency please use a qualified frequency counter and connect it to the TCK and GND pins on the RH850 debug connector. Refer to the hardware reference to learn about the adapter pinout. |
SoC events
Performance units can count various SoC events, which are device-specific. The most common list of available events is given below. Please contact the chip vendor for an explanation of individual performance items.
SoC event type |
SoC event description |
|---|---|
Opcodes |
The number of instructions executed |
Branches |
The number of branch instructions executed |
IrqAckEI |
The number of acknowledged EI level interrupt requests |
IrqAckFE |
The number of acknowledged FE level interrupt requests |
AsyncExceptions |
The number of acknowledged asynchronous exceptions |
SyncExceptions |
The number of acknowledged synchronous exceptions |
AllCycles |
The CPU clock cycle number (note that if the CPU is in low power mode, this count will not increase) |
NoIrqCycles |
The CPU clock cycles of no interrupt handling (note that if the CPU is in low power mode, this count will not increase) |
IrqDisabledCycles |
The CPU clock cycles of interrupt disabled by DI/EI (note that if the CPU is in low power mode, this count will not increase) |
FetchRequests |
The number of instruction fetch requests |
FetchFromFlash |
The number of instruction fetch requests to FLASH |
FetchFromVCIBus |
The number of instruction fetch requests to VCI bus |
AccessDataCache |
The number of data fetch request to Flash ROM |
DCacheHit |
The number of non-wait response of the above request in data sub-cache |
CPU behavior manipulation
The Unit configuration dialog offers additional settings to control the CPU:
Break CPU on overflow
The CPU will break when the counter overflows. Use this to eliminate false measurements. Note that the CPU will only break at the point when the flag is set. If the flag has been previously set, then the CPU will not break. Reset the counters to clear the flags before you start with the measurements. The CPU will not break on the same instruction when the flag was set. The break will occur a couple of CPU cycles later.
Break CPU on threshold violation
The CPU will break when the threshold violation occurs. Counter values are compared to the threshold limit after each measurement ends (when stop condition is fulfilled). Note that the CPU will only break at the point when the flag is set. If the flag has been previously set, then the CPU will not break. Reset the counters to clear the flags before you start with the measurements. The CPU will not break right at the instruction when the flag was set. The break will a occur couple of CPU cycles later.
CPU event settings
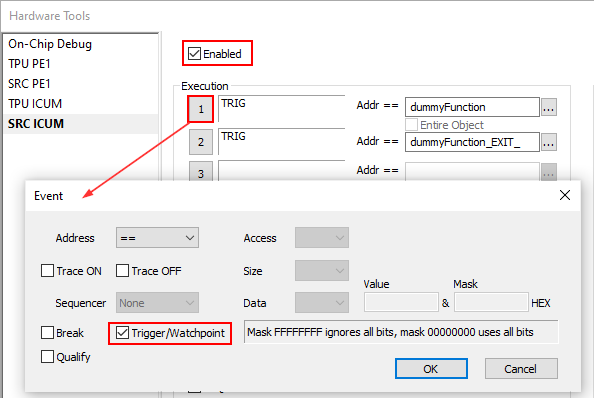
The CPU events are configured through the core-specific SRC pages.
1. Enable the On-Chip logic with the Enabled check box.
2. Press the number button to configure the comparators that you need for the plugin.
3. Enable the Trigger/Watchpoint generation for the required comparators. If the Watchpoint generation is enabled it will indicate this with TRIG status in the SRC/Internal page.
The SRC page is similar to the one available to set the Manual Hardware Trigger configuration for the Analyzer, because it uses the same CPU module.
If the trigger alone is not working, try also with the Trace ON check box ticked.
|
Note that this plugin should not be used at the same time as the Analyzer and its triggers. Please refer to the device reference manual for more details on the available on-chip logic. |