Trace overflows
In this topic:
•Solution: Configuring trace trigger and qualifier
Introduction
This topic builds a case against coding empty or very short program loops in embedded applications that can cause CPU program trace overflows and squander precious battery power.
Problem
You attach the debug-trace equipment to the hardware, start the trace and run the application. At best, a trace buffer is full in a couple of milliseconds. However, too often, trace fails even sooner because of overflows. This means that there are simply too many branches coming in succession, overwhelming the internal CPU trace logic that just can’t keep up with a torrent of branch messages.
In the last decades, a program trace does not report every single instruction executed but, as an optimization, reports only a change of flow, a.k.a. branch instructions. A post-trace analysis software fills in the blanks.
Use Case
After a hardware and software initialization is done, the application usually just waits in an endless loop for external events and acts upon them when they occur, next to periodic interrupts for application maintenance and sanity checks.
The main() function of a typical embedded application looks like this:
main() { |
Consequences
A simple loop like the one above raises two important issues:
1. The power in embedded applications is often of a particular importance. Usually it’s very expensive for automotive, mobile and other off-grid applications. Modern embedded CPUs execute instructions in excess of 200MHz and thus makes very little sense to spend the limited resources by incessantly branching to the top of the loop, while waiting to do something useful.
2. The while(1) loop is essentially just a branch to self. As mentioned above it will fill up the CPU trace, its branch-messaging logic almost instantaneously, rendering a very powerful tool useless.
Solutions
The following presents some of the possible solutions.
Solution: Snooze instruction
Relieve the CPU from the branching strain, at least for a few tens of nanoseconds, availability depending on instruction set architecture, of course. Some CPU architectures, e.g. RH850, support the snooze opcode that’s equivalent to 32 nop opcodes, for example. So, instead of a branch message every 10ns it may come at every 160ns. Which can be decisive when trying to record the program flow for as long as possible.
while (1) |
The same approach can be applied when coding a fast status poll loop.
while (0 == OSTM5TE) |
Solution: Halt instruction
Let the CPU sit tight until an interrupt calls into action. Upon fetching the halt opcode the CPU enters a HALT execution state that will be terminated by an interrupt.
while (1) |
Solution: Low power mode
Let the CPU conserve power while waiting for action. Before entering a low-power mode make sure to enable wakeup factors such as interrupts and also a debugger request. Consider the latency that takes the CPU to spring back to full flight mode.
void CPU_Sleep(enum ELowPower eMode) { … // configure wakeup factors and enter STOP mode |
Solution: Configuring trace trigger and qualifier
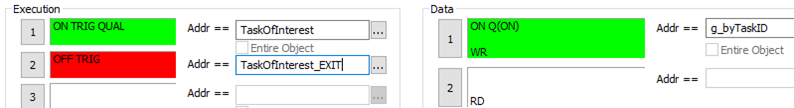
Configuring trace trigger and qualifier to focus on select application functionality. In some cases the code may not be changed anymore. Hence it is necessary to find a solution within the specific trigger and qualifier settings. One of the obvious steps is to exclude the code section that causes a trace overflow and is not of particular interest. The trick is simply in specifying the function or line of code where the trace should start (trigger) and, specify what should be stored in the trace buffer (qualifier). An arbitrary trace configuration example below:
|
A detailed discussion of a trace configuration is beyond the scope of this technical note. Please refer to this section and a vendor documentation on CPU trace capabilities. Note that not all devices support trace. Usually, vendors provide special extended device versions on emulation adapters that incorporate the advanced trace functionality. |
Conclusion
Trace is a very powerful tool for finding and eliminating bugs. Take your time to learn how to use it most effectively. In coding, special care should be taken about what the CPU is doing while waiting in an idle loop. Otherwise the system will drain excessive power which costs battery life. Furthermore, it becomes increasingly difficult to use high-end debug & trace tools for chasing bugs. Solutions to mitigate these issues are not limited to the ones presented above and depend on specific use cases.