Trace Qualifiers
This chapter explains manually configure qualifiers via Processor Observation Blocks (POB):
Each of the POBs can be connected to one of the TriCore CPUs. The POB can monitor the instruction execution and the data transactions performed by the CPU. Thus, a POB can generate trace messages for program flow trace and for data access trace. In addition, a POB offers various types of hardware comparators which allow to limit/focus trace to particular areas of interest, e.g. limit data access trace of specific data address ranges or limit program trace to specific program code areas (e.g. functions).
All Observation blocks, Triggers, Events and Actions in winIDEA are named the same as in the Infineon documentation. Refer to your device data sheet to learn more about these items.
This trace operation mode is used, when it’s required to trace the application around a particular event or when only some parts of program or data have to be recorded. In practice it turns out to be the most important matter defining meaningful trace qualifiers.
Each observation block has its own Trace Qualifier Unit (TQU) and its own pool of possible. A manual configuration process of a POB is done from right to left:
These are also referred as pre-triggers. Pre-trigger is a system state (status bit or comparator output).
The right most column lists all available trace triggers of a POB. Such triggers are generated by hardware comparators implemented in a POB. The comparators are typically configured to generate a trigger on an address or data match, i.e. when the CPU executes an instruction located at a specific address, when the CPU accesses (read/write) specific memory locations or when the CPU read/writes a specific data value to/from memory. A trigger can then be mapped to one or multiple events.
An event is the combination of pre-triggers at a certain point of time. Events can also be formed by an logical AND combination of multiple triggers (e.g. write access to a specific address AND write of a specific data value). An event can finally be connected to one or multiple actions.
An action is something to be done when an event happens. Such actions can for instance be the start of program trace or the capture of an address and value of a data write access
The MCX is not paired with a specific core or bus, but interfaces to the TQUs of all observation blocks. A central trace qualification unit contains the bulk of its functionality. Additionally the central time base (TSU), the usual watch-point message generation (WTU) and message sequencer (MSU) building blocks are implemented.
Open Manual Trigger Configuration. |
Refer to topic Manual Trace Configuration.
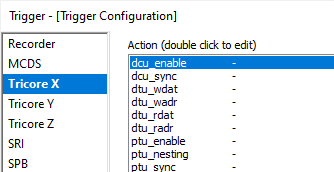
Select an observation block (TriCore/POB, SRI, SPB, ...). |
![]() |
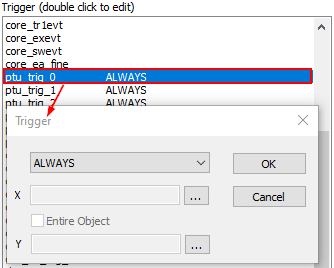
Select and edit Triggers. |
Note that you configure the setting from right to left.
![]() Double click to open the dialog. |
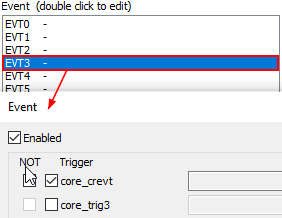
Select and edit Events. |
![]() Double click to open the dialog. |
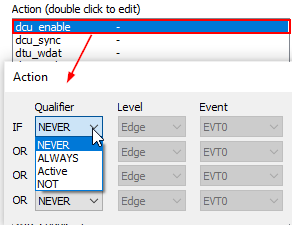
Select and edit Actions. |
![]() 1. Double click to open the dialog. 2. Check the Enabled box. 3. Configure Events. |
Create a Trace Template. |
When you achieve a desired Trigger/Qualifier configuration, you can create a Trace Templates by clicking Create template at the bottom of the dialog.
More resources |
Learn more about typical configurations in AURIX Trace Overview and Use-Cases.