Infineon TriCore
In this topic:
•Debug and Trace via EMEM/DAP – iC7max & Infineon DAP/DAPE II Active Probe
•Debug and Trace via AGBT – iC7max & Infineon AGBT Active Probe
•AURIX Debug and Trace Architecture
The information provided in this chapter is intended to be used together with the CPU reference manual provided by the silicon vendor. This chapter assumes knowledge of the CPU functionality and the terminology and concepts defined and explained in the CPU reference manual. Basic knowledge of winIDEA is also necessary. This chapter deals with specifics and advanced details and it is not meant as a basic or introductory text.
•CPU Options Configuration - Settings to prepare winIDEA for debug session
•Debug - Breakpoint access, SCR and HSM debug, Real-time memory access and more
•Analyzer - Trace, Aurora trace port, Trace templates, Profiler and Coverage
Getting started
Refer to Getting started Tutorials.
Debug Features
•DAP Standard (2-wire), DAP Wide (3-wire) and JTAG debug interface •DAPE trace interface on AURIX-2G and AURIX-3G •Hardware execution breakpoints •Unlimited software breakpoints •Hardware data access breakpoints •Flash programming |
•Multi-core support •Real-time memory access •Hot Attach •Stopping peripherals (e.g. TIMERs) when stopped (CPU-dependent) •On-Chip Trace support (miniMCDS, MCDS) •Aurora trace support (CPU-dependent) |
Debug via Debug Adapter
•Basic and compact system
•Debug Access via JTAG/DAP
•Optional Trace Support (EMEM, DAP) on Emulation Devices
Debug and Trace via EMEM/DAP
•High-Performance, versatile System
•Debug Access via JTAG/DAP
•Trace Support via on-chip EMEM and DAP Streaming (Upload While Sampling - UWS)
Debug and Trace via EMEM/DAP – iC7max & Infineon DAP/DAPE II Active Probe
•High-Performance, versatile system
•Debug Access via JTAG/DAP
•Trace support via on-chip EMEM and DAP Streaming (Upload While Sampling - UWS)
•DAP + DAPE support for TC3xx, TC4x Family
•Optional Add-On Modules:
oCAN/LIN Use case Configuration
•Synchronized Debug & Trace of multiple BlueBox
Debug and Trace via AGBT – iC7max & Infineon AGBT Active Probe
•Highest Trace Performance, versatile System
•Ideally suited for long-term multi-core Program & OS Trace
•Debug Access via DAP
•Trace Support via on-chip EMEM or high-speed AGBT Streaming
•Optional Add-On Modules:
oCAN/LIN Use case Configuration
•Synchronized Debug & Trace of multiple BlueBox
•Up to 10 m FNet Cable to the iC7max/iC5700 BlueBox
•Compact & robust design
•Active Probe Infineon AGBT: Bitrate up to 2.5 Gbps, upload rate app. 300 MB/s
AURIX Specific Trace Use Cases
DAP Streaming - Upload While Sampling (UWS)
•Allows Upload of Trace Data from EMEM to Host PC (winIDEA) while Trace Recording is running
•If Upload Bandwidth is higher than the Trace Data Generation Rate, Upload While Sampling can run infinitely
•Ideally suited for (long-term) OS Profiling
•DAP/DAPE II Active Probe allows DAP Operation at maximum 160 MHz for optimized Streaming Bandwidth
•A minimum of 2 (better 3) EMEM Tiles need to be available for Trace
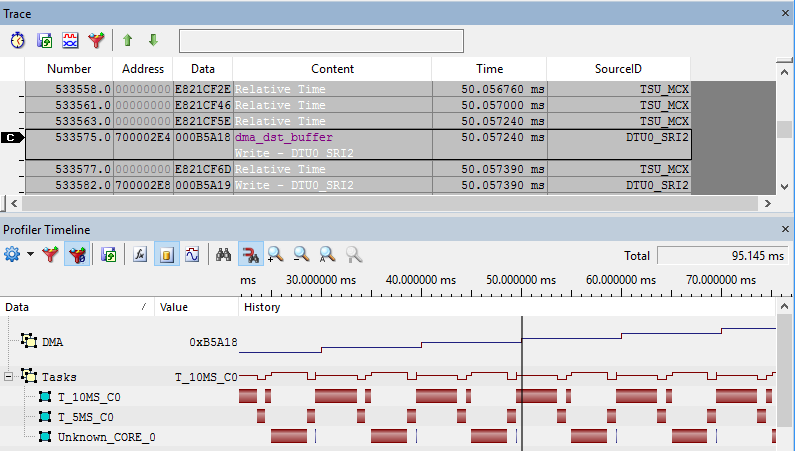
DMA Trace
The winIDEA Trace Analyzer allows full utilization of the extremely versatile configuration options of the AURIX MCDS On-Chip Trace functionality. This allows, for instance, tracing of SRI bus transactions of specific bus masters such as the DMA controller along with the CPU instruction trace or OS task trace.
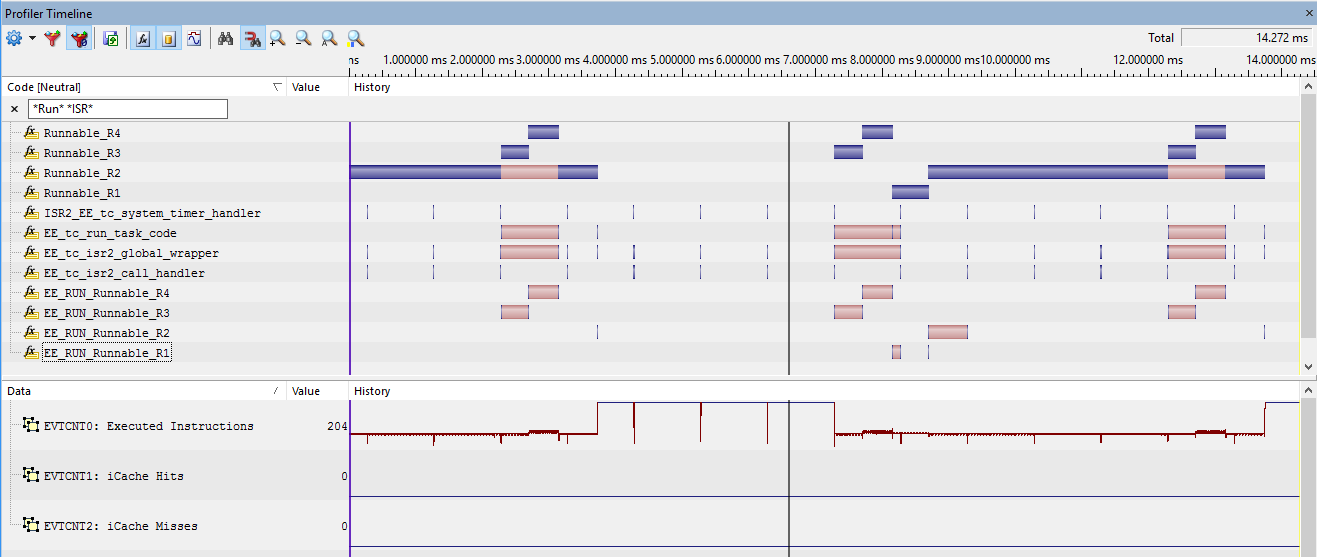
Trace of CPU Performance Counters
The winIDEA Trace Analyzer allows full utilization of the extremely versatile configuration options of the AURIX MCDS on-chip Trace functionality. This allows, for instance, a real-time trace of the CPU-internal performance counters, measuring performance parameters such as Instruction Execution rate, Cache Hit / Miss rates, etc.
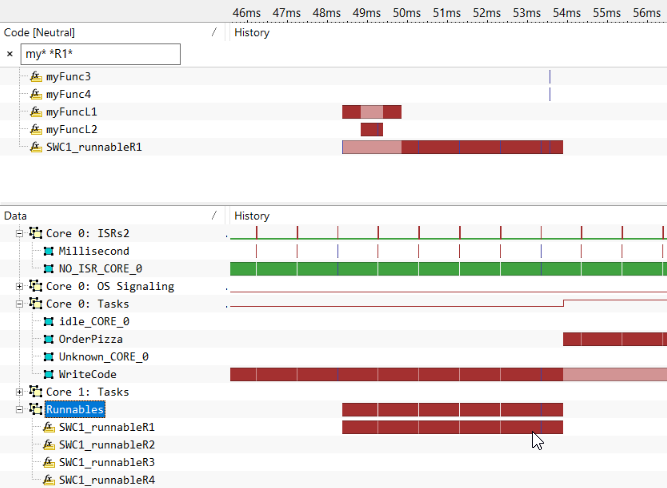
Compact Function Trace (CFT)
CFT is a feature of the MCDS Processor Observation Block (POB). Its goal is to reduce trace bandwidth, while providing the ability to trace function execution. Trace messages are only generated upon a function call and function return. Also, indirect calls (e.g. Interrupt Service Routines) generate a trace message.
This concept brings big savings especially when long functions are executed, as all instruction execution inside the function generates no trace data. However, the CFT concept relies on consistent function call-return sequences. Certain compiler optimizations “violate” this constraint and thus CFT-based function profiling may not be applicable.
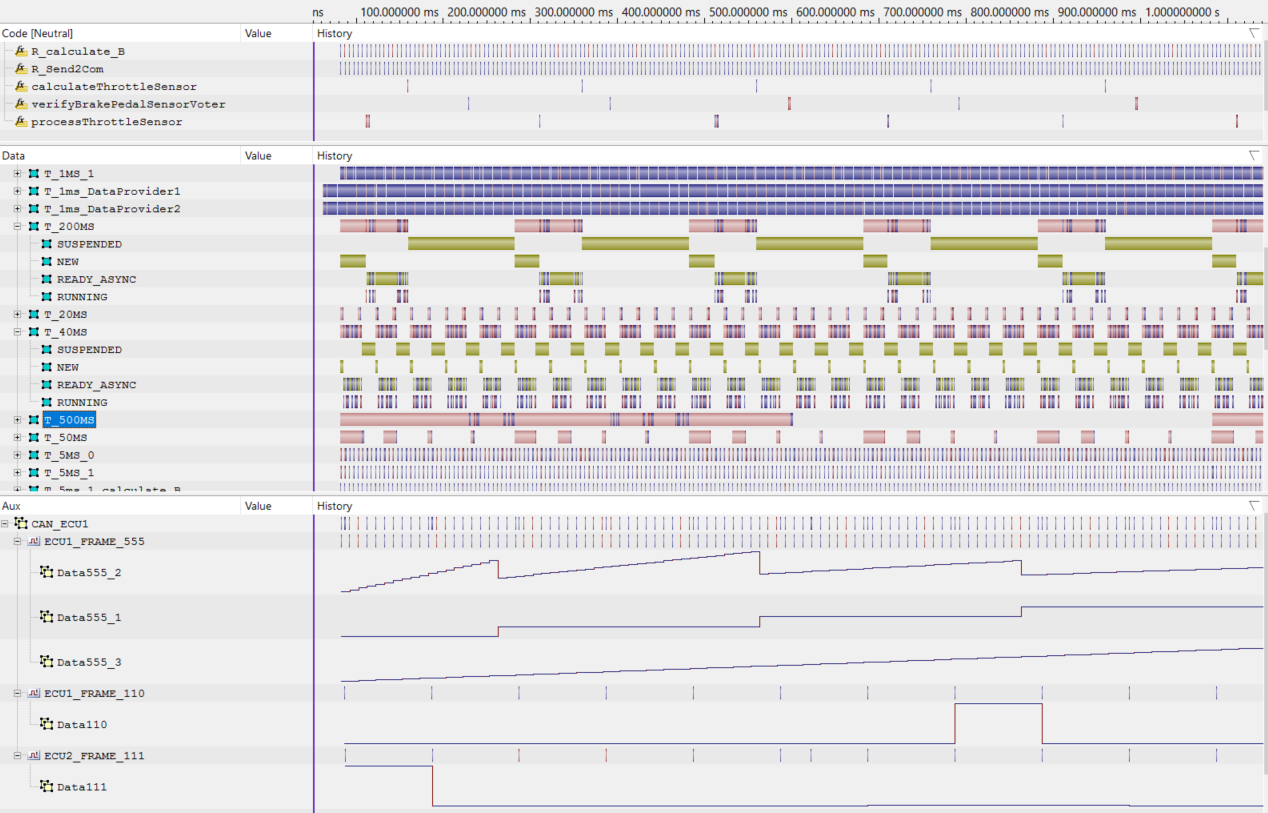
ADIO & CAN Trace
A trace recording via DAP UWS allows a time correlation with Analog/Digital or CAN/LIN bus signals captured by means of the ADIO and/or CAN/LIN Add-On Module of the iC7max/iC5700 BlueBox.
AURIX Debug and Trace Architecture
Infineon 32-bit AURIX production devices provide debug capability (OCDS) by default while they don’t provide a Trace functionality. Infineon offers a dedicated pin compatible Emulation Device (ED), which features also the Trace functionality. BlueBox connects to the OCDS debug module through fast DAP debug interface or an optional slower JTAG debug interface.
Trace on the Emulation Device is built around the MCDS and the EMEM subsystems. The MCDS is the core component and connects to all internal buses being visible to the trace and on the other side to the EMEM, a trace storage buffer from where the trace data is uploaded to the PC.
Typically EMEM trace data is uploaded off the chip through the DAP debug interface. Due to a limited bandwidth and being also shared with the OCDS module, optionally a dedicated DAPE debug interface is available for uploading the trace data from EMEM.
Another alternative to the DAPE debug interface, is a high-speed serial AGBT interface, which allows trace uploads at transfer rates of several Gbit/s.
|
The naming system can indicate whether an AURIX device supports trace, e.g.: •E, F (only TC2xx) – Emulation Device (TC375TE, TC277TE, TC299TF) •P, “-” (TC2xx) – Production Device (TC377TP, TC275TP) For more information refer to TriCore Naming Convention. |
Connecting to the Target
Debug and Trace solutions:
•DAP Debug Adapter
•JTAG Debug Adapter
•Infineon DAP/DAPE II Active Probe
oDAP Debug interface up to 160 MHz
oDAPE Trace interface up to 160 MHz
•Infineon AGBT/SGBT Active Probe
oDAP Debug interface up to 160 MHz
oAGBT Trace interface
Interface |
iC7max with Active Probe |
iC5700 |
iC5700 with Active Probe |
JTAG |
|
|
|
DAP |
|
|
|
DAPE (TC3xx) |
AP DAP/DAPE II |
|
AP DAP/DAPE II |
AGBT (Aurora) |
AP AGBT/SGBT |
|
AP AGBT/SGBT |
More resources
•Infineon AURIX - Microcontroller list, supported by winIDEA


