CAN/LIN Use cases Configuration
In this topic:
•Network traffic sniffing - Filtering messages
•Network traffic sniffing - Description files
•CAN/LIN message as trigger for trace recording
•Periodic CAN message injection
•Further trigger configuration
Requirements
•winIDEA
•iC7max/iC5700 BlueBox with iC5700 Hub
•Active Probe
•CAN/LIN Add-on module
 CAN/LIN example setup with two iC7max, Active Probes and CAN/LIN |
 CAN/LIN example setup with two iC5700, Active Probes and CAN/LIN |
|
CAN/LIN module doesn’t send an ACK (Acknowledgement) after detecting a message. This means that you should use an already working bus (two or more nodes connected with ACK response) otherwise an ACK error will be detected and the message will be retransmitted indefinitely by the sender. Do note as well that the CAN bus can be traced as a separate entity even if the microcontroller does not have any trace capabilities but in this case a synchronous trace won't be possible. |
For a general overview refer to CAN/LIN Use cases overview.
General configuration
Before you can start using the CAN/LIN module to record network data, its global configuration has to be set. In this example, a CAN1 channel with classic CAN protocol and a baudrate of 500 kbps will be observed.
|
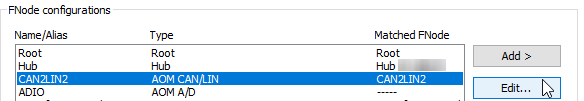
Create a CAN/LIN FNode via Hardware | Options | FNet and press Edit. |

|
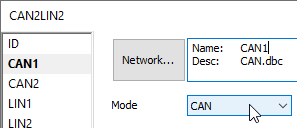
Select CAN from the Mode drop-down. |

|
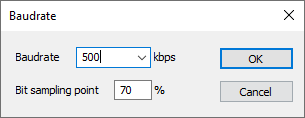
Press Arbitration Phase to adjust the Baudrate to 500 kbps. |

The general configuration is set and you can continue with the following use cases.
|
If you are using ADIO in an automated setup, the necessary configuration can also be done in a script (e.g. Python). You can use FNet classes which can be used to control all the FNet nodes. |
Network traffic sniffing
1. Create new (or modify the existing) Analyzer Configuration via View | Analyzer.
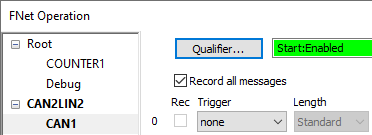
2. Enable the FNet check box and press Configure to open the FNet Operation dialog.
3. Open CAN1 page and make sure option Record all messages is checked.
4. Press Qualifier and enable option Recording is enabled from the start.
The CAN1 page is now set.
5.Start the Analyzer Session.
After starting and stopping the Analyzer Session, a list of recorded messages will be displayed under the Aux tab in the Profiler Timeline.

Information about messages is displayed similar to the Code and Data trace, with which you might already be familiar, including the more detailed properties and statistics of each message (e.g., its average period) in Profiler Statistics window which offers different types of statistics information: Interval Statistics, Area Statistics, Session Statistics.
|
For more information how to operate with Profiler Statistics window refer to Profiler Statistics. |
Network traffic sniffing - Filtering messages
This feature is used when debugging a heavy traffic network. Below example shows how to configure a trigger with one message with a particular ID on the whole network.
To enable message filtering navigate to the FNet Operation dialog, select the appropriate channel and configure the filtering options. An example, where only the message with ID 0x110 will be recorded, is shown below.
1. Open FNet Operation | CAN1 page.
2. Configure Trigger 0 and enter the ID.
Disable Record all messages check box if enabled. The Rec check box is grayed disabled if Record all is checked.

Network traffic sniffing - Description files
To include a description file in winIDEA follow these steps:
1. Open the CAN/LIN dialog via Hardware | Options | FNet.
2. Select the appropriate channel.
3. Add the description file to the list via Network | Add.
Results of the recording
Using these two features, Filtering messages and Description files results in the window as shown in the picture below.
Only frames from the message with configured ID are recorded, and their raw data analyzed and shown in a more user-friendly fashion. Placing a marker (black vertical line) on a timeline will show the value of each signal at that time. Some additional statistical properties are also available for the message and each one of the signals.

CAN/LIN message as trigger for trace recording
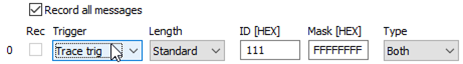
1. Open FNet Operation | CAN1 page.
2. Configure the Trigger 0.
a.Check option Record all messages.
b.Select Trace trig from the Trigger drop-down.
c.Enter ID and Mask.
3. Start the Analyzer Session manually
After that an CAN/LIN will be inspecting the network data and on detection of a specified message start the trace recording. This can be either an entire program flow or snippets of it, data or network trace or anything else according to your device’s capabilities and must be configured separately. The displayed configuration will only start the trace recording but not set what to record.
Result of the recording
In our example the whole program trace was recorded as can be seen in the picture below.

Periodic CAN message injection
This example demonstrates the use of a counter module triggering a periodic transmission of a CAN message to, for example, keep the target ECU from entering a shutdown mode.
Counter configuration
Configure the COUNTER1 to generate the TC4 trigger each one second.
•Qualifier - Disabled (or set as needed; analyzer-only option)
•Count on Time - Enabled — 1000 µs (user-required)
oEvent - None (may be different but typically unused here)
•When count increment trigger - None (only required if you need an external trigger to increment)
•Start active - Enabled (must be enabled so counting starts at session start)
oRestart on - None (if set differently it may stop periodic behaviour)
oSuspend on - None (if set differently it may stop periodic behaviour)
•Counter limit - Enabled, 1000 µs (must match Count on Time)
•When limit is reached - Trigger TC4 (required — the CAN action listens for TC4)
•Restart - Enabled (ensures the counter repeats and so makes the trigger periodic)

Example of the COUNTER1 configuration
CAN1 configuration
1. Configure the CAN1 module.
Refer to Message Injection.
2. Set the required target parameters in the FNet Operation page.
•Record injected messages - Enabled (optional / analyzer setting)
•Action - TC4 (must match the counter’s trigger)
•Length - Extended (user choice)
•ID - (user-specified target ID)
•Type - Data (user choice)
•Data - (user-specified bytes; byte order is left → right)

Example of the CAN1 configuration
This setup will send a single CAN message with above ID and Data every second as soon as the session is started in winIDEA by Download, Load Symbols, Reset, or Prepare to Attach commands. The Data is sent in byte-order from left to right, 0x55 first.
Troubleshooting
1. Check basic settings first.
Confirm the CAN protocol and baud rate match the network and target ECU.
2. Use winIDEA Analyzer or an oscilloscope and check that the message is generated in the prescribed interval
If you observe that the messages come densely one after another, it's possible that the communication line is not properly terminated and CAN1 transmitter is thus sending retries every 300us, for example.
3. Fix the line termination and ensure that there are at least two active CAN nodes present on the line.
Further trigger configuration
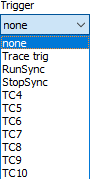
Other triggers can be raised on detection of a specific message, not just trace trigger. Current possibilities are shown in the picture below:
•Trace trig operation is described above.
•RunSync and StopSync can be used when working with interconnected BlueBoxes and synchronously debugging multiple targets.
•TC4 - TC10 can be used as manual triggers or as a means of interconnecting the various operations available on CAN/LIN and other FNet devices.
winIDEA SDK example
All of the described use cases can be replicated and automated using our winIDEA SDK for a variety of different programming languages. This Python script example shows how to perform message injection and export data
Message injection
The Python script shows how to:
•Configure a response message reception;
•Start a new Profiler session;
•Run a target and manually injecting a message via SDK;
•Set a breakpoint;
•Run the target until the breakpoint is hit;
•Inject a CAN message after it;
•Use winIDEA SDK for Python.
|
The messages can be injected as long as there is a valid connection between winIDEA and BlueBox, it does not matter if the target is running or stopped or if the analyzer session is started. |
Exporting and analyzing data
Once the desired data has been captured, you can continue with its analysis. You can export the data into a number of different external files (XML, BIN or BTF) for use with external analysis tools, or use winIDEA SDK to analyze the captured events.
During the analysis, let's assume that you’re only interested in CAN messages that contain data for Signal_Rx8bit_Cyclic. A capture of these messages can be seen in the picture under chapter Filtering messages and description files. Each one of these messages is for analysis purposes represented as a time event, with its handle, value and timestamp.
Output example for one of the timeEvents - CProfilerTimeEvent:
handle: 1073741836 |
More resources
•fnetCAN.py - Basic FNet Root Counter controller initialization and usage
•export_profiler_data.py - Profiler and export
•Python Examples by Groups - Python examples are available for various actions, e.g., Debug Control, Trace, Profiler, FNet, winIDEA control and options etc