Debug applications using the Synopsys nSIM simulator in winIDEA
In this topic:
Key points
Quickly set up and debug an application through the Synopsys nSIM instruction set simulator by:
1. Install winIDEA and obtain your nSIM and winIDEA vECU licenses.
2. Create a workspace with GDB Client, configure a launch for nsimdrv.exe, and set the GDB port.
3. Run Debug > Attach to start the simulator and open a full debug session
Result: A running debug session in winIDEA connected to the Synopsys nSIM simulator via GDB, with full debug control over your application without physical hardware.
Overview
This guide shows how to configure winIDEA to launch the Synopsys nSIM simulator as a gdbserver and connect to it as a GDB client, enabling source-level debugging of your application without a hardware target..
By the end, you will be able to:
•Configure winIDEA to launch nSIM automatically and connect via GDB on a specified port
•Use the full winIDEA debugger (breakpoints, stepping, watch, memory) against the nSIM simulated target
Before you start
Requirements
•winIDEA 9.21.265 or newer
•Synopsys nSIM simulator
•Synopsys nSIM license
•winIDEA vECU license
Background knowledge
•Synopsys nSIM simulator is an instruction set simulator and therefore doesn’t simulate the full SoC. This should be taken into consideration when writing an application.
•winIDEA connects to nSIM using the GDB remote protocol: nSIM acts as a gdbserver (listening on a TCP port), and winIDEA acts as the GDB client. The port number must match in both the nSIM launch configuration and the winIDEA GDB options.
Steps
Follow these steps to configure and start a debug session with the Synopsys nSIM simulator.
Step 1: Create a new winIDEA workspace
In winIDEA, open File > Workspace > New Workspace. In the New Workspace dialog:
1. Select workspace name and location.
2. Under Debugger select GDB Client.
3. Select Create.
winIDEA creates the workspace and opens the Basic Session Configuration dialog.
Step 2: Configure winIDEA session
1. Under Device select RISCV32I device.
2. Select the Symbol file to use and choose No Program file.
3. Continue with Switch to Full.
The Session Configuration window opens, showing additional tabs including Launches.
Step 3: Configure Launches
1. Select Launches page and add a new launch configuration.
2. Configure the Executable and the Command line parameters. In this example they are configured as follows:
•Executable:
C:/ARC/nSIM_64/bin/nsimdrv.exe
•Command line:
-gdb -port 13335 -p nsim_isa_family=rv32 -p nsim_isa_ext=All -p nsim_semihosting=1 $(AppSymFile)
3. Disable options:
•Show window (runs nsimdrv.exe silently in the background)
•Wait for completion (winIDEA must not block waiting for nSIM to exit)
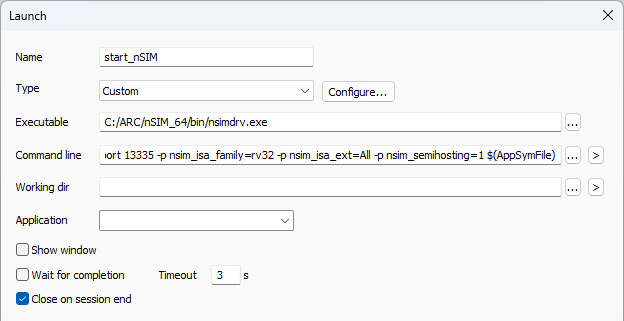
4. Confirm the changes.
Step 4: Configure GDB connection
1. Open the GDB > Options from the main winIDEA menu.
2. Enable GDB connects to gdbserver.
3. Configure the port to match the setting from the previous step (in this case 13335).
winIDEA is configured to connect to the nSIM gdbserver on port 13335.
Step 5: Start the debug session
In winIDEA select Debug > Attach.
winIDEA will:
•Launch nsimdrv.exe with your configured command line
•Wait for nSIM to open its GDB server port
•Connect as a GDB client on port 13335
•Load symbols from the .elf file and set the PC to the entry point
The simulator is running and winIDEA shows the source at the application entry point. You have full debug control: breakpoints, step over/into, watch expressions, and memory inspection.
Validation
After Debug > Download completes, check the following:
•The winIDEA status bar shows STOP.
•The source view highlights the first line of main()(or your configured entry point)
•The Debug toolbar is active (Run, Step Over, Step Into buttons are enabled).
To confirm execution, click Run (F5). The application should execute.
Resources
•winIDEA SDK - User's Guide