Debug RISC-V applications using the TASKING simulator in winIDEA
In this topic:
•Use winIDEA featured Example Workspace
•Create a new winIDEA workspace
Key points
Quickly set up and debug a RISC-V application without real hardware by:
1.Install winIDEA.
2.Create a winIDEA workspace using the featured Example Workspace or configure a new one manually.
3.Download your application and start a full debug session in the simulator.
Result: A running RISC-V debug session in winIDEA connected to the TASKING simulator, with full debug control over your application.
Overview
This guide shows how to configure winIDEA to connect to the TASKING RISC-V instruction set simulator (ISS) and debug a RISC-V application without physical hardware.
Use this guide when:
•You want to debug a RISC-V application before hardware is available
•You need a reproducible, hardware-independent debug environment
•You are evaluating the TASKING RISC-V toolchain using the bundled simulator
By the end, you will be able to:
•Start a RISC-V simulator session from winIDEA and download an application
•Use the full winIDEA debugger (breakpoints, watch, stepping) against the simulated target
There are two ways to get started
•Use the featured example for the fastest path
•Create a new workspace if you have your own application
Before you start
Requirements
•winIDEA 9.21.395 or newer
Background knowledge
•TASKING RISC-V simulator is an instruction set simulator and therefore doesn’t simulate the full SoC. This should be taken into consideration when writing an application.
•Basic familiarity with the winIDEA workspace and session configuration dialogs is helpful but not required.
Use winIDEA featured Example Workspace
The easiest way to try out TASKING RISC-V simulator in winIDEA is to use the featured Example Workspace.
1. Open winIDEA and select Start with Example Workspace...
2. Select RV32I TSK SIMULATOR GCC Example Workspace.
3. Select Clone and Open Example…
winIDEA clones the example project to a local folder and opens it. The workspace is pre-configured for the TASKING simulator.
Create a new winIDEA workspace
Step 1: Configure workspace
In winIDEA, open File > Workspace > New Workspace. In the New Workspace dialog:
1. Select workspace name and location.
2. Under Debugger select GDI interface simulator.
3. Select Create.
winIDEA creates the workspace and opens the Session Configuration dialog.
Step 2: Configure winIDEA session
1. Under Device select RISCV32I device.
2. Under Symbol file, browse to your .elf file.
3. Choose Use the Symbol file to Program the Device.
3. Select Preset the PC to application’s entry point and confirm.
The session is configured and winIDEA is ready to connect to the simulator.
Step 3: Configure RISC-V extensions (optional)
The basic options are automatically configured when workspace is created. To modify them, open GDI > Options.
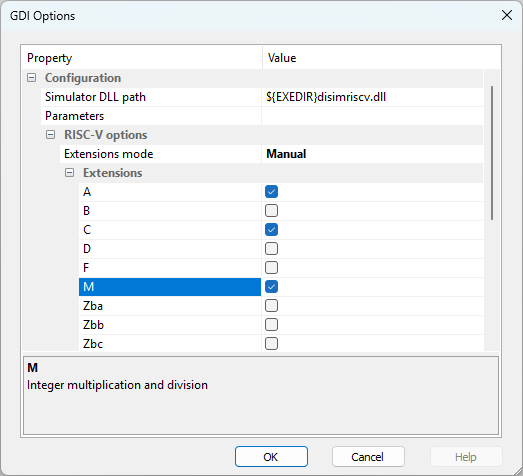
Under RISC-V options, the RISC-V extensions used in the simulation can be configured. All the extensions used when building the application should be enabled.
•Choose the Extensions mode:
oDevice - uses the extensions as defined in the winIDEA device description file. For RISCV32I, an array of extensions is defined, which covers most of the common use cases.
oManual - allows each individual extension to be enabled or disabled. This is done using the checkboxes under Extensions.
•Extensions - only used when the Manual Extension mode is selected.
All RISC-V extensions used when building your application must be enabled here. A mismatch causes illegal instruction errors at runtime.
Step 4: Start the debug session
Select Debug > Download.
winIDEA will:
•Launch the TASKING RISC-V simulator process
•Establish the GDI connection
•Download the program to the simulated device
•Set the program counter to the application entry point
Validation
After Debug > Download completes, check the following:
•The winIDEA status bar shows STOP.
•The source view highlights the first line of main()(or your configured entry point)
•The Debug toolbar is active (Run, Step Over, Step Into buttons are enabled).
To confirm execution, click Run (F5). The application should execute.
Resources
•winIDEA SDK - User's Guide