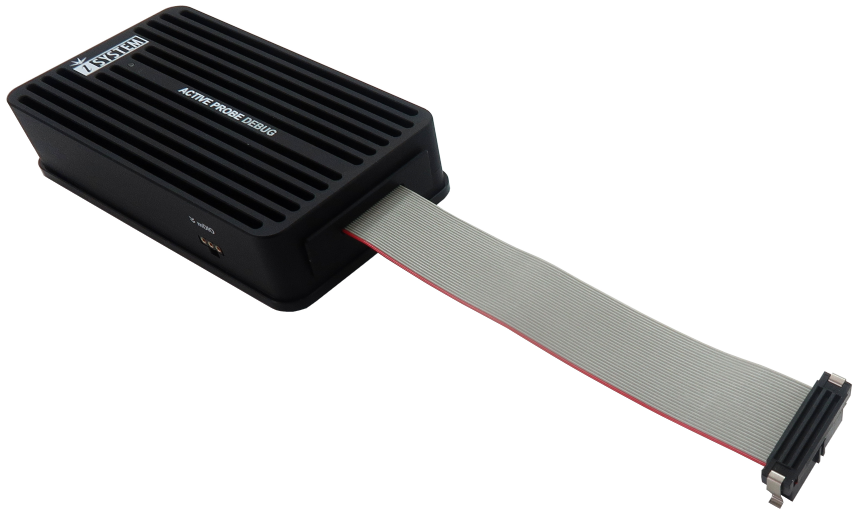
Active Probe Debug V1.8
Active Probe Debug enables debugging, tracing, and testing a range of microcontroller architectures supported by the winIDEA. It supports various debug protocols:
•Joint Test Action Group (JTAG)
•Arm Serial Wire Debug (SWD)
•RH850 Low Pin-Count Debug (LPD)
•Infineon Device Access Port (DAP)
•On-chip trace buffers
Besides that, it offers Trace Capture methods, including Arm's Embedded Trace Buffer (ETB), and low-speed serial trace, like Single Wire Output (SWO); and RH850 Software Trace.
Its compact size facilitates connections to target microcontrollers in tight spaces, extending up to 10 meters away.
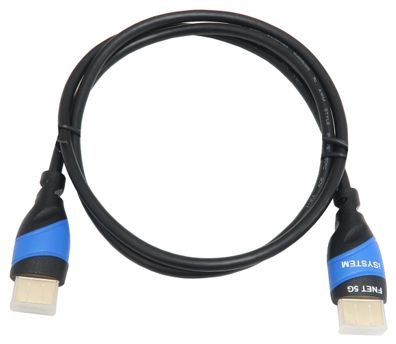
Active Probe Debug is connected to the iC7max and iC5700 BlueBox on one side via FNet cable. To connect the Active Probe to an embedded target with an architecture-specific target connector, an iC7 / Active Probe Adapters must be ordered separately. If your target connector's pinout doesn't align with the Active Probe Adapter's pinout, you have the option to order a Converter.

BlueBox Hardware Setup with Active Probe Debug
The Active Probe Debug kit is delivered with the following components:
Active Probe Debug |
1m FNet Cable |
|---|---|
Ordering code with iC7max: IC71801 Ordering code with iC5700: IC57801 |
Ordering code: BB-FNET-100 |
|

